National Mid-Season Flu Vaccination Coverage, National Flu Survey, United States, 2011-12 Influenza Season
Authors: Erin D. Kennedy, DVM; Tammy A. Santibanez, PhD; Carolyn B. Bridges, MD; James A. Singleton, MS; Immunization Services Division, NCIRD
Influenza vaccination coverage estimates by first week of November 2010 and 2011 and by mid-March 2010, National Flu Survey
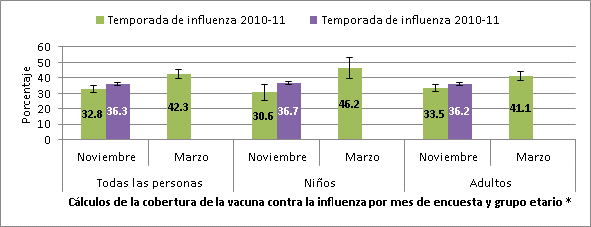
* All persons include persons ≥ 6 months; Children include those 6 months to 17 years; Adults include those ≥ 18 years.
Introduction
The severity of influenza varies from year to year with about 3,000 to 49,000 influenza-related deaths occurring each year (1). Annual influenza vaccination is the best method of protection against influenza and its complications. The Advisory Committee on Immunizations Practices recommends annual influenza vaccination for all persons 6 months and older (2). The Healthy People 2020 influenza vaccination targets are annual coverage of 80% for persons 6 months–64 years and 90% for adults ≥ 65 years and adults 18–64 years with high-risk conditions or living in long-term care facilities and nursing homes (3).
To provide national mid-season estimates of influenza vaccination coverage and behaviors and opinions regarding influenza vaccines during the 2011-12 influenza season, CDC conducted the National Flu Survey (NFS) during November 1-13, 2011. The NFS will be conducted again in March 2012 to provide rapid end-of-season influenza vaccine coverage estimates. This report describes national estimates of the proportion of people vaccinated by approximately November 6, 2011, using results from the November 2011 NFS.
Key Findings
- Many children and adults remained unvaccinated by the first week of November; 36.3% of people 6 months and older, 36.7% of children, and 36.2% of adults had already received influenza vaccination by this time.
- These estimates are higher for children and similar for adults compared to coverage estimates from the November 2010 NFS (Table 1) and suggest that overall vaccine uptake for the 2011-12 is on track with the 2010-11 season.
- Estimated coverage among Hispanic and non-Hispanic other race children were higher when compared to non-Hispanic white children, and coverage for non-Hispanic black and white children was similar. These preliminary results suggest that we have sustained the increased coverage among Hispanic and non-Hispanic black children seen during the 2010-11 season. However, as in prior seasons, influenza vaccination coverage among adults was higher for non-Hispanic whites compared to other racial and ethnic groups.
- Results from the March 2011 NFS showed a 10% increase in coverage estimates to 42.3% among all persons ≥ 6 months from November 2010 through mid-March of the 2010-11 season. If the trend continues this season, overall coverage will still remain substantially below the Healthy People 2020 influenza vaccination targets.
- Influenza vaccinations should continue throughout the influenza season. Additional efforts are needed by medical providers and other immunization providers to enhance access and increase community demand for influenza vaccination, particularly among those at higher risk of severe complications from influenza, including young children, people of any age with high-risk medical conditions, and older adults.
Who’s At Risk?
Results of November 2011 National Flu Survey
2011 Influenza Vaccine Coverage Estimates by First Week of November by Age Group
All Ages
- Among all persons ≥ 6 months, estimated influenza vaccination coverage was 36.3%, 3.5 percentage points higher than at this time last season (Table 1).
| November 2010 % ± 95% CI * |
November 2011 % ± 95% CI * |
|
|---|---|---|
| Overall (≥ 6 months) | 32.8 ± 2.4 | 36.3 ± 1.2† |
| Children (6mos-17 yrs) | 30.6 ± 5.0 | 36.7 ± 2.6† |
| Adults (≥ 18 yrs) | 33.5 ± 2.5 | 36.2 ± 1.3 |
* Percentages are weighted to the U.S. population; CI-Confidence interval half-width
† Estimate from November 2011 NFS statistically significantly different from November 2010 NFS estimate, p<0.05
Children
- Among children 6 months through 17 years of age, estimated vaccination coverage by the first week of November was 36.7%. Coverage was 6.1 percentage points higher compared to this time last season (Table 2).
| November 2010 % ± 95% CI * |
November 2011 % ± 95% CI * |
|
|---|---|---|
| All children (6 mos-17 yrs) | 30.6 ± 5.0 | 36.7 ± 2.6† |
| 6m-4 years | 44.4 ± 11.2‡ | 45.7 ± 5.2 |
| 5-12 years | 28.2 ± 7.0 | 37.4 ± 3.9† |
| 13-17 years | 21.4 ± 9.3 | 27.6 ± 4.6 |
* Percentages are weighted to the U.S. population; CI-Confidence interval half-width
† Estimate from November 2011 NFS statistically significantly different from November 2010 NFS estimate, p<0.05
‡ Estimate may not be reliable, confidence interval half-width >10.0
Adults
- Among adults ≥ 18 years, estimated vaccination coverage was 36.2%, similar to this time last season.
- Among adults 18 to 64 years, estimated coverage was 30.9% for all persons in this age group, 3.7 percentage points higher than at this time last season.
- Estimated vaccination coverage in adults 18 to 64 years with at least one high-risk condition was similar to last year at 41.5%.
- Estimated vaccination coverage in adults 18-64 years without a high-risk condition was 27.3%, a 4.3% gain over last year.
- Among adults ≥ 65 years, estimated vaccination coverage was 62.3%, similar to coverage at this time last season.
| November 2010 % ± 95% CI * |
November 2011 % ± 95% CI * |
|
|---|---|---|
| All adults (≥ 18 yrs) | 33.5 ± 2.5 | 36.2 ± 1.3 |
| 18-64 years | 27.2 ± 2.7 | 30.9 ± 1.4† |
| 18-64 years, HR‡ | 38.9 ± 6.1 | 41.5 ± 3.0 |
| 18-64 years, non-HR‡ | 23.0 ± 3.0 | 27.3 ± 1.6† |
| 65+ years | 64.3 ± 4.8 | 62.3 ± 2.2 |
* Percentages are weighted to the U.S. population; CI=Confidence interval half-width
† Estimate from November 2011 NFS statistically significantly different from November 2010 NFS estimate, p<0.05
‡ High-risk includes asthma, other lung problems, diabetes, heart disease, kidney problems, anemia, weakened immune system caused by a chronic illness or by medicines taken for a chronic illness. High-risk also includes obesity for November, 2011 NFS; HR=High-risk.
Early November 2011 Influenza Vaccine Coverage Estimates by Race/Ethnicity
Children
- Among children 6 months to 17 years, coverage estimates were comparable among non-Hispanic whites (33.5%) and non-Hispanic blacks (35.5%) (Table 4).
- Among children 6 months to 17 years, estimated coverage among Hispanic (43.4%) and non-Hispanic other or multiple race (43.6%) children was higher compared to non-Hispanic white children (33.5%).
- Estimated coverage for Hispanics was 15.6 percentage points higher than this time last year.
| November 2010 % ± 95% CI * |
November 2011 % ± 95% CI * |
|
|---|---|---|
| Children (6m-17 years) | ||
| Hispanic | 27.8 ± 10.1‡ | 43.4 ± 5.8† || |
| Non-Hispanic, white only | 31.9 ± 6.4 | 33.5 ± 3.3 |
| Non-Hispanic, black only | 26.8 ± 17.3‡ | 35.5 ± 8.1 |
| Non-Hispanic, other§ | 35.0 ± 17.1‡ | 43.6± 7.7|| |
* Percentages are weighted to the U.S. population; CI=Confidence Interval half-width
† Estimate from November 2011 NFS statistically significantly different from November 2010 NFS estimate, p<0.05
‡ Estimate may not be reliable, confidence interval half-width >10.0 or (CI half width/Estimate) < 0.6
§ Includes Asian, American Indian and Alaska Native (AIAN), Native Hawaiian or other Pacific Islander, multiracial, and other races.
|| Estimate statistically significantly different from estimate for non-Hispanic whites during the same time period, p<0.05
Adults
- Among adults ≥ 18 years, coverage was higher for non-Hispanic whites (39.9%) compared to non-Hispanic blacks (28.0%), Hispanics (26.0%) and non-Hispanic other or multiple races (34.8%) (Table 5).
| November 2010 % ± 95% CI * |
November 2011 % ± 95% CI * |
|
|---|---|---|
| Adults (≥ 18 years) | ||
| Hispanic | 24.2 ± 7.3‡ | 26.0 ± 3.5‡ |
| Non-Hispanic, white only | 36.8 ± 2.9 | 39.9 ± 1.5 |
| Non-Hispanic, black only | 27.2 ± 7.0‡ | 28.0 ± 3.4‡ |
| Non-Hispanic, other§ | 29.6 ± 11.1† | 34.8 + 4.6‡ |
* Percentages are weighted to the U.S. population; CI=Confidence Interval half-width
† Estimate may not be reliable, confidence interval half-width >0.0 or (CI half width/Estimate) < 0.6
‡ Estimate statistically significantly different from estimate for non-Hispanic whites during the same time period, p<0.05
§ Includes Asian, American Indian and Alaska Native (AIAN), Native Hawaiian or other Pacific Islander, multiracial, and other races.
Place of Vaccination
- The most common place of vaccination among both children (63.3%) and adults (31.6%) was a doctor’s office. Other medically-related places were also common places of influenza vaccination for children (26.9%) and adults (23.2%). Other common places of influenza vaccination reported for adults included pharmacies or stores (21.0%) and workplace (16.3%) (Figure 1).
Figure 1. Place of Vaccination for children and adults by the first week of November, November 2011 National Flu Survey.
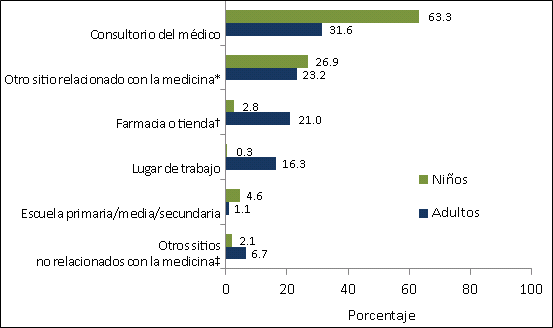
* Other medically-related place includes hospital, clinic or health center, local health department, and other unspecified medically-related place.
† Pharmacy or store includes pharmacy or drug store and local supermarket or grocery store.
‡ Other non-medical place includes senior center, military-related place, other school, such as college or trade school, home and other unspecified non-medical place.
Knowledge of Influenza Vaccination Recommendation
- When asked which groups are recommended to get the flu vaccine, only 50.8% of adults responded correctly that influenza vaccination was recommended for all people six months and older. Vaccinated adults were more likely to know that the vaccine was recommended for all individuals six months or older (60.9%) than unvaccinated individuals (45.1%).
What Can Be Done?
Summary and Public Health Implications
Vaccination coverage by age
- Data from the November NFS suggest that coverage by the 1st week of November 2011 is higher for children and similar for adults compared with this time last year.
Vaccination coverage by race/ethnicity
- Estimated coverage among Hispanic and non-Hispanic other race children were higher when compared to non-Hispanic white children. These preliminary results suggest that increased coverage among Hispanic and non-Hispanic black children seen during the 2010-11 was sustained during this season.
- Racial and ethnic disparities still remain among adults when compared to non-Hispanic whites. Continued efforts to increase vaccination coverage among other racial and ethnic groups are necessary to decrease these disparities.
Knowledge of influenza vaccination recommendation
- Almost half of individuals were unaware that all individuals ≥ 6 months are recommended for influenza vaccination. Enhanced public education about the recommendation is necessary to ensure that all individuals are aware of this recommendation.
Public Health Implications
- Although many adults (36.2%) and children (36.7%) had already been vaccinated against influenza by the first week of November 2011, many more still need to be protected.
- Although the majority (58%) of persons vaccinated during the 2010-2011 season received their influenza vaccinations before the first week of November, 23% of vaccinated persons received their vaccination during November and 19% during December-May (5). Influenza vaccinations are still taking place and should continue throughout the flu season.
- Influenza activity in the United States does not typically peak until January or February and influenza activity was low as of the third week in November (4). Therefore, it is not too late to get vaccinated.
- Those who intend to get vaccinated should be vaccinated as soon as possible before influenza activity increases. It takes approximately 2 weeks for protective antibody to reach optimal levels after vaccination.
- Results from the March 2011 NFS showed a 10% increase in coverage estimates among all persons ≥ 6 months when compared to the November 2010 results. If this trend continues this season, coverage rates will again fall well below all Healthy People 2020 objectives for influenza vaccination. Continued efforts are needed to increase vaccination coverage rates of all individuals by enhancing access and increasing community demand for influenza vaccination.
- Strong recommendations by providers for their patients to get vaccinated are effective in increasing patient acceptance of vaccination. Providers are encouraged to recommend and offer influenza vaccination to their patients throughout the influenza season.
- Providers who do not offer influenza vaccination in their clinic should refer their patients to vaccine providers in their community.
- Standing orders, client reminder and recall systems, and provider reminders are also important strategies proven to increase vaccination uptake (6).
- The November NFS is designed to provide rapid estimates of national influenza vaccination coverage and to assess the effectiveness of current immunization efforts. Additionally, the NFS is a useful tool for assessing how vaccination coverage so far this season compares to vaccination coverage by the same time last season.
- The NFS will be conducted again in March 2012 to provide rapid end-of-season influenza vaccine coverage estimates.
Limitations
Vaccination occurs throughout the influenza season; during the 2010-11 influenza season, 19% of vaccinations were administered after November. Additionally, date of vaccination administration may differ between age and racial and ethnic groups. Therefore, the trends reported here may not be reflected in our end-of-season coverage estimates.
The NFS has been conducted in only the 2010-11 and 2011-12 influenza seasons. Ideally, trends in vaccination coverage across seasons should be evaluated using the same data source. Thus, estimates from the November 2011 NFS should be compared to the November 2010 NFS. However, the survey methods used in the NFS differ from those of other surveys utilized to estimate national immunization coverage, e.g. Behavioral Risk Factor Surveillance System (BRFSS), National Health Interview Survey and National Immunization Survey (NIS). More robust end-of-season national and state-specific estimates from the BRFSS and the NIS will be available at the end of the 2011-12 influenza season.
NFS interviews were conducted during November 1-13, and vaccinations reported as of the date of the interview; thus, the vaccination coverage estimates reflect approximately the cumulative percent of persons vaccinated by the midpoint of the interview period (November 6, 2011). All data rely upon self-report and are not validated with medical records. Non-response bias may remain after weighting adjustments.
Data Source and Methods
These estimates are based on data from the November 2011 National Flu Survey (NFS), one of two surveys (one in November and one in March) planned to rapidly collect influenza vaccination-related data during the 2011-12 influenza season. The purpose of the November survey is to provide timely within season estimates to inform influenza immunization stakeholders and the public on the progress towards reaching influenza coverage objectives and for possible modification of vaccination and communication strategies during the influenza season.
The sample for the NFS was a list-assisted random digit-dial sample of both landline and cell telephones. Sample selection was carried out separately for landline and cell telephone numbers. Interviews for the November NFS were conducted November 1 through November 13, 2011. An advance letter was sent to landline households for which the telephone number could be matched to an address. The survey interviewers conducted the survey in both English and Spanish with language line interpretation services used to conduct the survey in other languages. Households were screened into the survey based on the presence of a household member 18 years or older. Cell telephone respondents were screened into the survey if they were a “cell telephone only” household (i.e., they reported that they do not maintain a landline telephone in their household) or a “cell telephone mainly” household (i.e., they maintain a landline but are unlikely to answer it if it rings while an adult is at home), and they were 18 years or older. For the landline sample, the youngest male 18 years and older currently at home was selected for inclusion. If there were no males at home, the youngest female 18 years and older was selected for inclusion in the survey. This screening method is a tested approach for balancing the age and gender of respondents. For the cell telephone sample, the adult who answered the cell phone was asked about flu vaccinations. For interviews pertaining to children, the adult respondent was asked the ages of all children in the household younger than 18 years in both the landline and the cell telephone samples. One child was then randomly selected and the adult respondent was asked about the influenza vaccination status of that child. On average, 3.1 call attempts were made for each sampled number released to the telephone center.
To achieve a higher proportional representation of three racial/ethnic groups – Hispanic, non-Hispanic black, and non-Hispanic Asian – selected geographic areas were oversampled. For the landline sample, selected counties were oversampled, and for the cell phone sample, selected states were oversampled.
The survey questionnaire included questions about: current influenza season vaccination status, vaccination intent during the current season, and behaviors and opinions related to flu vaccination. Demographic questions were included as were questions about health conditions to ascertain the high-risk status for influenza-related complications.
The Council of American Survey Research Organizations (CASRO) response rate was 31.1% for landlines and 19.5% for cell phones. The CASRO response rate is the product of the percentage of telephone lines identified as residential or non-residential the percentage of known households with a completed screening interview, and the percentage of eligible respondents who complete the interview. A total of 16,289 interviews were completed for adults (12,555 from landline and 3,734 from cell only/mainly households), and 3,815 for children 6 months to 17 years (2,797 from landline and 1,018 from cell only/mainly households). All estimates were weighted with weights derived based upon the probability of selection of the telephone number (incorporating the oversampling of geographic areas), incorporating adjustments for non-response at the telephone number resolution and household screening stages, probability of selecting the adult/child of interest within the household, and for person non-response. The data are also weighted using a ratio adjustment to population controls (age, sex, race/ethnicity, and geographic area).
Related Links
- Results from the November 2010 National Flu Survey–United States, 2010-11 Influenza Season [652 KB, 7 pages]
- Results from the March 2011 National Flu Survey–United States, 2010-11 Influenza Season [570 KB, 8 pages]
- Influenza Vaccination Distribution and Coverage, United States, 2010-11 and 2011-12 Seasons [1.4 MB, 30 pages]
- CDC Influenza Awareness Campaign: Media Toolkit [550 KB, 23 pages]
- Follow CDC Flu on Twitter: @CDCFlu
References/Resources
- CDC. Estimates of Deaths Associated with Seasonal Influenza—United States, 1976—2007. MMWR 2010; 59(33);1057-1062.
- CDC. Prevention and control of influenza with vaccines: recommendations of the Advisory Committee on Immunization Practices (ACIP), 2010. MMWR 2011;60(33);1128-1132.
- HealthyPeople.gov Immunization and Infectious Diseases
- Situation Update: Summary of Weekly FluView
- Final state-level influenza vaccination coverage estimates for the 2010–11 season–United States, National Immunization Survey and Behavioral Risk Factor Surveillance System, August 2010 through May 2011
- The Community Guide: Vaccinations to Prevent Diseases: Universally Recommended Vaccinations