Influenza Vaccination Coverage Among Health Care Personnel — United States, 2020–21 Influenza Season
The Advisory Committee on Immunization Practices (ACIP) recommends that all health care personnel (HCP) receive an annual influenza vaccination to reduce influenza-related morbidity and mortality among HCP and their patients as well as to reduce absenteeism among HCP (1-6). CDC conducted an opt-in Internet panel survey of 2,391 U.S. HCP to estimate influenza vaccination coverage during the 2020–21 influenza season. Overall, 75.9% of HCP reported receiving influenza vaccination during the 2020–21 season. Coverage was lower than in the previous season in which 80.7% of HCP reported vaccination, however the difference was not statistically significant (5). Influenza vaccination coverage significantly decreased in 2020–21 season among assistant/aides (10.8 percentage points) and pharmacists (6.0 percentage points). Physicians, nurses, and pharmacists had the highest coverage (91.3%, 90.3%, and 90.3%). Coverage was lowest among assistant/aides and non-clinical personnel (64.8% and 69.0%). By setting, coverage was highest among HCP working in hospitals (91.6%) and lowest among HCP working in long-term care facilities (LTCF)/home health care settings (66.0%). An employer vaccination requirement was one of the strongest factors associated with vaccine receipt; coverage was the highest among HCP who were required by their employer to be vaccinated (95.9%), and the lowest among HCP whose employers neither required nor recommended vaccination (46.0%). Receipt of a COVID-19 vaccine was the second strongest factor correlated with higher influenza vaccination coverage. Implementing workplace strategies to improve vaccination coverage among HCP, particularly those working in LTCF/home health care setting, can help ensure that HCP and patients are protected against influenza (7,8). Reducing the overall burden of respiratory illnesses in the upcoming season by maximizing HCP influenza vaccination uptake can protect HCP and vulnerable populations and conserve healthcare resources for the treatment of COVID-19 patients.
An Internet panel survey of HCP was conducted from March 30 to April 15, 2021, to provide estimates of influenza vaccination coverage among HCP during the 2020–21 influenza season. Similar surveys have been conducted since the 2010–11 influenza season. Respondents were recruited from two preexisting national opt-in Internet sources: Medscape, a medical website managed by WebMD Health Professional Network*, and general population Internet panels operated by Dynata†. Responses were weighted to the distribution of the U.S. population of HCP by occupation ‡, age, sex, race/ethnicity, work setting, and Census region. The sampling weights were developed to produce estimates that approximate the U.S. population of HCP based on the estimated numbers of persons in each major occupational category by age, race/ethnicity, gender, work setting, and Census region. A post-stratification weight for each responding person in the survey was calculated by fitting a generalized exponential model and estimating the model parameters using calibration equations (9). To ascertain the number of employees in each occupational category that was required for the weight’s calculation, population control totals were used§. This year, two major changes were implemented for the calculation of HCP population control totals: First, Bureau of Labor Statistics employment codes were filtered by health care industry, which mostly affected the administrative support staff or managers and the non-clinical support staff control totals. Second, six months of Current Population Survey data (July through December) were used instead of three months (October through December), as was done in Spring 2020. Additionally, this year the weights were calculated controlling not only for the main effects (occupation, age group, race/ethnicity, gender, work setting, and Census region), but also for the interaction terms between occupation and the other main effects. (The estimates for 2019-20 survey obtained using both approaches are presented in Table 1S in the Supplement). Among 2,588 eligible participants, a total of 2,434 completed the survey (completion rate = 94.0%||). Participants (n=43) were excluded if they answered that their occupational setting was “other” than those listed, and the verbatim description did not qualify as a health care setting, leaving 2,391 respondents in the analytic sample.
Estimated (weighted) proportions and corresponding confidence intervals (CIs) for vaccination coverage are presented by each work setting, occupation, demographic characteristics, and influenza vaccination status for the 2020-21 season. The Korn-Graubard method was used to calculate confidence intervals for proportions, assuming that the weighted estimates are approximately unbiased¶. The National Center for Health Statistics (NCHS) reliability criteria for proportions were applied to the estimates in the descriptive analyses of HCP characteristics, reasons for getting and not getting an influenza vaccine, and for the attitudes toward influenza vaccine and illness (10). Chi-square testing was utilized to assess differences in the estimated influenza vaccination coverage between subgroups and the responses to attitudes questions. SAS 9.4 (Cary, NC) and SAS-callable SUDAAN software (version 11.0.1; RTI International) were used to conduct all analyses.
Overall, 75.9% of HCP reported having received an influenza vaccination during the 2020–21 season (Table 1). Non-Hispanic White HCP had the highest (79.9%), and non-Hispanic Black HCP (67.4%) had the lowest vaccination coverage among race/ethnic groups. HCP with more than a college degree had significantly higher vaccination coverage (81.4%) than those with some college education or less (66.7%). Vaccination coverage was highest among HCP working in hospitals (91.6%) and lowest among HCP working in LTCF/home health care settings (66.0%). By occupation, vaccination coverage was highest among physicians (91.3%), nurses (90.3%) and pharmacists (90.3%) and lowest among assistants/aides (64.8%) and non-clinical HCP (69.0%). Influenza vaccination coverage was significantly higher among HCP whose employer required influenza vaccination (95.9%) than HCP whose employer recommended (76.2%) or did not recommend or require vaccination (46.0%). Finally, influenza vaccination coverage was significantly associated with receipt of a COVID-19 vaccine: influenza vaccination coverage was 36.6 percentage points higher among HCP who received at least one dose of a COVID-19 vaccine. Compared with the 2019-20 influenza season, statistically significant decreases in vaccination coverage were observed among assistants/aides (10.8 percentage points), HCP with an associate or bachelor’s degree (9.2 percentage points), and pharmacists (6.0 percentage points). Overall vaccination coverage this season was 4.9 percentage points lower than in the 2019-20 season, however the difference was not statistically significant.
The main reasons for not getting an influenza vaccine among unvaccinated HCP in the 2020 -21 season were “I do not need the vaccination” (17.3%), “I might experience side effects or get sick from the vaccine” (12.2%) and “I don’t think the vaccination is effective in preventing flu” (11.8%) (Figure 1). The main reasons for getting an influenza vaccine were “To protect myself from flu” (36.0%), “Because it was mandatory, or I had to for work” (22.3%) and “To reduce flu’s impact on the health care system during the COVID-19 pandemic” 10.5%) (Figure 2).
A majority of HCP agreed or strongly agreed with statements on attitudes towards influenza vaccination, including statements such as “Flu vaccine is safe” (87.0%), “If I get a flu vaccine, people around me would be protected” (82.3%), and “Getting a vaccine is worth the time and expense” (81.4%) (Figure 3, Table 2S). The estimated percent vaccinated among HCP who agreed or strongly agreed with the attitude statements toward influenza vaccination ranged from 80.4% to 89.7% and was significantly higher compared with HCP who disagreed or strongly disagreed with those statements (24.1% to 67.3%). Among 62.4% of HCP who agreed or strongly agreed with the statement that “HCP should be required to be vaccinated” 89.7% were vaccinated, while among 37.6% of HCP who expressed disagreement with the statement above 53% were vaccinated. Approximately equal proportions (half) of HCP expressed agreement and disagreement with the statement that flu is a serious threat to their health.
Overall influenza vaccination coverage among HCP during the 2021–21 season was similar to coverage in the previous season (5). However, statistically significant decrease in influenza vaccination coverage since the 2019–20 season were observed among assistants/aides, pharmacists and HCP with an associate or bachelor’s degree. As in previous seasons, non-clinical personnel and assistants/aides, HCP working in LTCF or home health care settings and HCP with less than a college degree had the lowest coverage among all occupations, work settings and education levels, respectively.
Concerns about side effects and vaccine effectiveness were reported by HCP as common reasons for not getting an influenza vaccine. Employers’ vaccination requirement was the second most commonly reported reason for vaccination. Measured attitudes were consistent with the reasons for getting or not getting a flu vaccine; positive attitudes towards safety and effectiveness of influenza vaccine were strongly associated with higher vaccination coverage. Over approximately 60% of respondents agreed that HCP should be required by their employer to be vaccinated for influenza, and vaccination coverage in this group was nearly 90%, which was the highest among all other attitudes HCP agreed with. Receipt of influenza vaccine last season and this season is highly correlated with receipt of a COVID-19 vaccine. These findings suggests that receipt of influenza vaccine may be associated with a favorable attitude towards vaccination in general; therefore, may positively influence HCP’s decision to get a COVID-19 vaccine.
We found that an employer vaccination requirement at the HCP’s workplace is the strongest factor associated with influenza vaccination uptake among HCP; vaccination coverage was approximately 50 percentage points higher among HCP with employer vaccination requirements compared with HCP without employer vaccination requirements or recommendations. Previous studies identified that LTCF/home health care were among the work settings with the lowest proportion of HCP who reported having employer vaccination requirements (4,5,8). In the current study, vaccination coverage among HCP whose employer neither required nor recommended flu vaccination was the lowest among all HCP characteristics. Employer vaccination policies, such as a requirement to sign a waiver or a declination form if not vaccinated, or public identification of vaccinated individuals, have been shown to be effective in increasing influenza vaccination coverage in many work settings (7,8). A previous study found that various workplace vaccination promotions, such as on-site vaccination and vaccination at no cost, alone or combined with vaccination interventions, are also associated with higher vaccination coverage among HCP working in LTCFs (8). Our analysis suggests that even an employer’s recommendation for influenza vaccination may improve vaccination coverage and may be helpful in settings with low vaccination coverage such as LTCF/ home health care settings as well as settings with high proportion of assistants/aides and non-clinical personnel.
Useful resources that can help with increasing vaccination coverage among HCP include CDC’s long-term care web-based toolkit** which provides access to resources, strategies, and educational materials, and interventions recommended by the Community Preventive Services Task Force (6). These resources can be used by health care employers to increase influenza vaccination coverage among HCP and reduce influenza-associated morbidity and mortality among patients. Furthermore, given relatively lower COVID-19 vaccination coverage in the same HCP subgroups that showed lower influenza vaccination coverage in this analysis (11,12), it is especially important to implement systems that support and encourage vaccination of HCP, particularly HCP working at LTCFs and home health care settings. Previous findings have demonstrated that outbreaks of COVID-19 in LTCFs have a critical impact on the health of vulnerable older adults (13). Many of the long-established public health actions aimed at increasing influenza vaccination coverage among HCP can be used not only for routine vaccinations but also for improving a COVID-19 vaccination coverage (8).
The findings in this report are subject to at least four limitations. First, the study used a nonprobability sample of volunteer members of Medscape and Dynata Internet panels. While responses were weighted to be representative of the U.S. population of HCP and a number of other approaches were implemented to reduce the bias inherent in nonrandom samples, some bias may still remain in the coverage estimates. Second, the self-selection of the respondents to the panels and to the survey may introduce selection bias. Third, vaccination status was self-reported and may be subject to recall or social desirability bias. Finally, insufficient sample size resulted in the coverage estimates in some subgroups not meeting the NCHS reliability criteria for reporting proportions.
Authors: Svetlana Masalovich, MSc1,2, Hilda Razzaghi, PhD2, Jazmin Duque, MPH3, Michael Witt, MA3, Marie A. de Perio, MD4, A. Scott Laney, PhD5, Carla L. Black, PhD2
1Kapili Government Services, LLC., Atlanta, GA; 2Immunization Services Division, National Center for Immunization and Respiratory Diseases, CDC; 3Abt Associates, Inc., Atlanta, GA; 4Office of the Director, National Institute for Occupational Safety and Health, CDC; 5Division of Respiratory Health, National Institute for Occupational Safety and Health, CDC.
Footnotes
*Physicians, nurse practitioners, physician assistants, nurses, dentists, pharmacists, allied health professionals, technicians, and technologists were recruited from the current membership roster of Medscape. Additional information on Medscape is available at https://www.medscape.com.
†Assistants, aides, and non-clinical personnel (such as administrators, clerical support workers, janitors, food service workers, and housekeepers) were recruited from general population Internet panels operated by Dynata. Additional information on Dynata and its incentives for online survey participants is available at https://www.surveysampling.com.
‡ Major occupational categories include physicians and dentists; nurse practitioners and physician assistants; nurses; pharmacists; other clinical personnel [including allied health professionals, technicians and technologists, EMTs and paramedics]; assistants and aides, and non-clinical personnel [including administrative support staff and managers, and non-clinical support staff].
- Population control totals of U.S. health care personnel by occupation and work setting were obtained from the Bureau of Labor Statistics, U.S. Department of Labor, Occupational Employment Statistics, May 2019, National Industry-Specific Occupational Employment and Wage Estimates (https://www.bls.gov/oes/current/oessrci.htm). Population control totals by other demographic characteristics were obtained from the U.S. Census Bureau, Current Population Survey Monthly Labor Force Data, December 2020 (https://www.bls.gov/cps/data.htm).
||A survey response rate requires specification of the denominator at each stage of sampling. During recruitment of an online opt-in survey sample, such as the Internet panels described in this report, these numbers are not available; therefore, a response rate cannot be calculated. Instead, the survey completion rate is provided.
¶Additional information on obstacles to inference in nonprobability samples is available at: https://www.aapor.org/AAPOR_Main/media/MainSiteFiles/NPS_TF_Report_Final_7_revised_FNL_6_22_13.pdf and https://www.aapor.org/getattachment/Education-Resources/For-Researchers/AAPOR_Guidance_Nonprob_Precision_042216.pdf.aspx. While the estimates reported here have variance, there has been no attempt to quantify the size of the variance.
References
- Immunization of Health Care Personnel: Recommendations of the Advisory Committee on Immunization Practices (ACIP), 2011. MMWR Recomm Rep 2011;60(No. RR-7): https://www.cdc.gov/mmwr/preview/mmwrhtml/rr6007a1.htm.
- Hayward AC, Harling R, Wetten S, Johnson AM, Munro S, Smedley J, et al. Effectiveness of an influenza vaccine programme for care home staff to prevent death, morbidity, and health service use among residents: cluster randomised controlled trial. BMJ. 2006;333(7581):1241.
- Lemaitre M, Meret T, Rothan-Tondeur M, Belmin J, Lejonc JL, Luquel L, et al. Effect of influenza vaccination of nursing home staff on mortality of residents: a cluster-randomized trial. J Am Geriatr Soc. 2009;57(9):1580-6.
- Black CL, Yue X, Ball SW, Fink RV, de Perio MA, Laney AS, et al. Influenza Vaccination Coverage Among Health Care Personnel – United States, 2017-18 Influenza Season. MMWR Morb Mortal Wkly Rep. 2018;67(38):1050-4.
- Acero C, Razzaghi H, Black CL, Wesley MG, Jeddy Z, Lindley MC, et al. 2020; Pages https://www.cdc.gov/flu/fluvaxview/hcp-coverage_1920estimates.htm.
- Worksite: Seasonal influenza vaccinations using interventions with on-site, free, actively promoted vaccinations – healthcare workers. Community Preventive Services Task Force website. June 2008. https://www.thecommunityguide.org/findings/worksite-seasonal-influenzavaccinations-healthcare-on-site. Accessed on August 23, 2021.
- Dey P, Halder S, Collins S, Benons L, Woodman C. Promoting uptake of influenza vaccination among healthcare workers: A randomized controlled trial. J Pub Health Med 2001;23: 346-348.
- Yue X, Black CL, Ball S, et al. Workplace interventions associated with influenza vaccination coverage among health care personnel in ambulatory care settings during the 2013-2014 and 2014-2015 influenza seasons. Am J Infection Control 2017;45:1243-1248.
- Folsom, R.E., and Singh A.C. The generalized exponential model for sampling weight calibration for extreme values, nonresponse, and post-stratification. 2000. Proceedings of the American Statistical Association, Section on Survey Research Methods, pp. 598-603.
- Parker JD, Talih M, Malec DJ, Beresovsky V, Carroll M, Gonzalez JF, Hamilton BE, Ingram DD, Kochanek K, McCarty F, Moriarity C, Shimizu I, Strashny A, Ward BW. National Center for Health Statistics Data Presentation Standards for Proportions. Vital Health Stat 2. 2017 Aug;(175):1-22. PMID: 30248016.
- Kaiser Family Foundation 2021. Pages https://www.kff.org/coronavirus-covid-19/press-release/kff-post-survey-of-frontline-health-care-workers-finds-nearly-half-remain-unvaccinated/. Accessed on June 11, 2021.
- Lee JT, Althomsons SP, Wu H, et al. Disparities in COVID-19 vaccination coverage among health care personnel working in long-term care facilities, by job category, National Healthcare Safety Network – United States, March 2021 MMWR Morb Mortal Wkly Rep 2021;70:1036-39.
- McMichael TM, Clark S, Pogosjans S, et al. COVID-19 in a long-term care facility — King county, Washington, February 27–March 9, 2020. MMWR Morb Mortal Wkly Rep 2020;69:339-342.
Table 1. Receipt of influenza vaccination among health care personnel by selected characteristics
— Internet Panel Surveys*, United States, April 2020 and April 2021
| 2019-20 | 2020-21 | Change from
2019-20 to 2020-21 |
|||
| Number (weighted %) | Weighted % vaccinated
(95% CI) |
Number (weighted %) | Weighted % vaccinated
(95% CI) |
Weighted % vaccinated
(95% CI) |
|
| Total/Overall | 2401 | 80.7 (76.9, 84.6) | 2391 | 75.9 (71.3, 80.1) | -4.9 (-10.7, 1.0) |
| Age | |||||
| 18-30 years (ref) | 371 (20.8) | 81.0 (70.7, 91.4) | 263 (17.5) | 65.0 (48.1, 79.5)† | -16.1 (-34.3, 2.1) |
| 30-45 years | 981 (35.6) | 79.9 (74.1, 85.7) | 1,007 (38.9) | 76.3 (69.8, 82.0) | -3.6 (-11.8, 4.6) |
| 45-60 years | 714 (29.6) | 79.1 (71.6, 86.5) | 774 (29.0) | 79.2 (72.0, 85.3) | 0.1 (-9.6, 9.9) |
| 60+ years | 335 (14.1) | 86.0 (78.0, 93.9) | 346 (14.6) | 81.3 (71.2, 89.0) | -4.7 (-16.2, 6.9) |
| Race/ethnicity‡ | |||||
| White, non-Hispanic (ref) | 1,494 (59.5) | 84.7 (80.7, 88.7) | 1,419 (61.4) | 79.9 (75.1, 84.1) | -4.8 (-10.7, 1.1) |
| Black, non-Hispanic | 302 (17.0) | 71.0 (58.8, 83.3) | 316 (17.0) | 67.4 (52.9, 79.9) | -3.6 (-21.3, 14.1) |
| Hispanic | 334 (14.1) | 77.1 (64.7, 89.6) | 399 (14.1) | 68.0 (48.5, 83.8)† | -9.1 (-30.0, 11.8) |
| Other, non-Hispanic | 269 (9.4) | 78.7 (66.2, 91.3) | 253 (7.5) | 77.1 (62.7, 87.9) | -1.7 (-18.9, 15.6) |
| Education | |||||
| Some college education or less (ref) | 541 (22.9) | 66.4 (57.7, 75.0) | 541 (29.1) | 66.7 (58.2, 74.6) | 0.4 (-11.4, 12.1) |
| Associate or bachelor’s degree | 804 (49.2) | 87.8 (83.8, 91.9) | 767 (45.2) | 78.7 (70.7, 85.3) | -9.2 (-17.2, -1.1) |
| More than college degree | 1,056 (27.9) | 80.1 (71.7, 88.4) | 1,082 (25.7) | 81.4 (74.4, 87.1) | 1.3 (-9.0, 11.7) |
| Occupation§ | |||||
| Physician (ref) | 236 (3.5) | 91.2 (70.0, 99.1) † | 283 (3.4) | 91.3 (85.2, 95.5) | 0.0 (-13.2, 13.3) |
| Nurse practitioner / Physician assistant | 136 (1.3) | 90.8 (69.8, 99.0) † | 147 (1.4) | 88.9 (56.0, 99.5)† | -2.0 (-24.6, 20.6) |
| Nurse | 174 (18.5) | 92.5 (88.3, 96.8) | 179 (18.4) | 90.3 (82.2, 95.5) | -2.2 (-9.7, 5.2) |
| Pharmacist | 304 (1.3) | 96.3 (91.3,98.9) | 309 (1.3) | 90.3 (86.4, 93.4) | -6.0 (-10.6, -1.4) |
| Other clinical personnel¶ | 577 (18.6) | 87.5 (80.8, 94.2) | 561 (18.8) | 83.0 (75.5, 89.0) | -4.5 (-13.8, 4.7) |
| Assistant/aide | 614 (24.3) | 75.5 (70.4, 80.7) | 577 (24.2) | 64.8 (60.4, 68.9) | -10.8 (-17.4, -4.2) |
| Non-clinical personnel|| | 316 (32.6) | 71.9 (62.4, 81.4) | 306 (32.5) | 69.0 (55.8, 80.2) | -2.9 (-17.9, 12.1) |
| Work setting** | |||||
| Hospital | 767 (36.8) | 92.1 (88.3, 96.0) | 914 (38.8) | 91.6 (87.8, 94.5) | -0.5 (-5.5, 4.4) |
| Ambulatory care | 693 (27.1) | 79.8 (74.0, 85.6) | 734 (22.8) | 77.3 (63.9, 87.6) | -2.5 (-15.1, 10.1) |
| Long-term care facility / home health care†† |
569 (28.5) | 73.8 (65.5, 82.0) | 576 (41.6) | 66.0 (57.6, 73.6) | -7.8 (-19.1, 3.5) |
| Other clinical setting‡‡ | 703 (16.9) | 72.2 (61.6, 82.8) | 629 (10.9) | 66.8 (54.6, 77.5) | -5.4 (-20.7, 9.8) |
| Location of primary workplace§§ | |||||
| Rural | 283 (11.8) | 66.8 (49.5, 81.3)† | 308 (12.2) | 71.6 (60.1, 81.4) | 4.9 (-13.3, 23.1) |
| Non-rural | 2,118 (88.2) | 82.4 (78.2, 86.1) | 2,080 (87.8) | 76.5 (71.3, 81.2) | -5.9 (-12.0, 0.2) |
| Region¶¶ | |||||
| Northeast (ref) | 455 (19.1) | 81.4 (72.9, 89.9) | 456 (19.8) | 83.6 (76.5, 89.2) | 2.2 (-8.2, 12.6) |
| Midwest | 370 (22.0) | 84.2 (77.2, 91.2) | 399 (23.3) | 73.9 (63.3, 82.9) | -10.3 (-22.0, 1.4) |
| South | 1,016 (36.4) | 79.4 (71.9, 86.9) | 1,024 (36.1) | 75.5 (67.5, 82.3) | -3.9 (-14.3, 6.4) |
| West | 560 (22.6) | 78.6 (71.6, 85.6) | 507 (20.8) | 71.5 (57.5, 83.1) | -7.1 (-21.1, 6.9) |
| Employer influenza vaccination requirement | |||||
| Required (ref) | 960 (44.2) | 95.0 (90.0, 98.0) | 843 (34.2) | 95.9 (92.6, 98.0) | 0.9 (-3.5, 5.3) |
| Recommended | 918 (37.0) | 78.6 (71.7, 85.5) | 1,024 (42.4) | 76.2 (69.9, 81.8) | -2.4 (-11.4, 6.6) |
| Not required or recommended | 523 (18.8) | 51.6 (38.6, 64.6) | 524 (23.4) | 46.0 (33.7, 58.7) | -5.6 (-23.3, 12.1) |
| Receipt of at least one dose of a COVID-19 vaccine | |||||
| Yes | N/A | 1,780 (68.2) | 87.6 (83.4, 91.1) | N/A | |
| No | N/A | 609 (31.8) | 51.0 (41.7, 60.2) | N/A | |
(ref): Referent group
Note: Bold case indicates statistical significance (p<0.05) when compared to referent group in the same season and when compared across seasons. The difference between percentages is based on unrounded percentages in each season.
* Respondents were recruited from two preexisting national opt-in Internet sources: Medscape, a medical website managed by WebMD Health Professional Network, and general population Internet panels operated by Dynata.
† Estimate does not meet the National Center for Health Statistic’s standards of reliability. https://www.cdc.gov/nchs/data/series/sr_02/sr02_175.pdf. These estimates are presented in this report for comparison purposes and should be interpreted with caution.
‡ Race/ethnicity was self-reported. Respondents identified as Hispanic might be of any race. The “Other” race category included Asians, American Indians/Alaska Natives, Native Hawaiians or other Pacific Islanders, and people who selected “other” or multiple races.
§Excludes students.
¶ Other clinical personnel include dentists, allied health professionals, technicians and technologists, emergency technicians, emergency medical technicians, and paramedics.
|| Non-clinical personnel include administrative support staff/manager and non-clinical support staff.
** Respondents could select more than one work setting. Each work setting is represented by a separate variable with two levels (yes/no, where reference level is no).
†† Nursing home, assisted living facility, other LTCF, home health agency, or home health care.
‡‡ Includes dentist office or dental clinic, pharmacy, emergency medical services, and other settings where clinical care or related services were provided to patients.
§ Rurality was defined using ZIP codes where >50% of the population resides in a nonmetropolitan county, a rural U.S. Census tract, or both, according to the Health Resources and Services Administration’s definition of rural population. https://www.hrsa.gov/rural-health/about-us/definition/index.html.
¶¶ Northeast: Connecticut, Maine, Massachusetts, New Hampshire, New Jersey, New York, Pennsylvania, Rhode Island, and Vermont. Midwest: Illinois, Indiana, Iowa, Kansas, Michigan, Minnesota, Missouri, Nebraska, North Dakota, Ohio, South Dakota, and Wisconsin. South: Alabama, Arkansas, Delaware, District of Columbia, Florida, Georgia, Kentucky, Louisiana, Maryland, Mississippi, North Carolina, Oklahoma, South Carolina, Tennessee, Texas, Virginia, and West Virginia. West: Alaska, Arizona, California, Colorado, Hawaii, Idaho, Montana, Nevada, New Mexico, Oregon, Utah, Washington, and Wyoming.
Figure 1. Main reasons* for non-receipt of influenza vaccine among health care personnel (n=470), — Internet panel surveys†, Unites States, April 2021
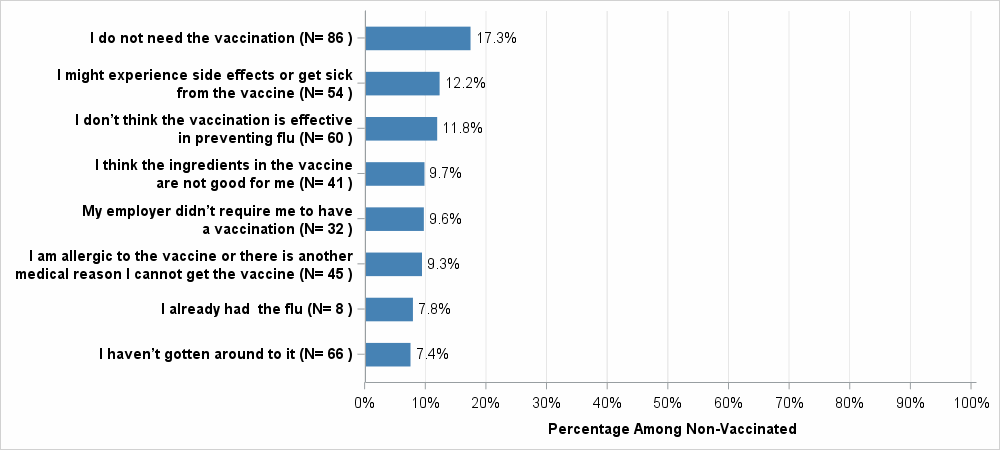
*The reasons with unreliable estimates according to NCHS reliability criteria (https://www.cdc.gov/nchs/data/series/sr_02/sr02_175.pdf) and reasons selected by less than 3% of respondents are not presented.
† Respondents were recruited from two preexisting national opt-in Internet sources: Medscape, a medical website managed by WebMD Health Professional Network, and general
population Internet panels operated by Dynata.
Figure 2. Main reasons* for receipt of influenza vaccine among health care personnel (n=1914), ─ Internet panel surveys †, Unites States, April 2021

*The reasons with unreliable estimates according to NCHS reliability criteria (https://www.cdc.gov/nchs/data/series/sr_02/sr02_175.pdf) and reasons selected by less than 3% of respondents are not presented.
† Respondents were recruited from two preexisting national opt-in Internet sources: Medscape, a medical website managed by WebMD Health Professional Network, and general population Internet panels operated by Dynata.
Figure 3. Attitude towards influenza vaccination and percent † vaccinated among health care personnel ─ Internet panel surveys*, Unites States, April 2021

*Percent of HCP who agree or disagree with each attitude statement and percent vaccinated among those who responded to the attitude question are weighted.
† Respondents were recruited from two preexisting national opt-in Internet sources: Medscape, a medical website managed by WebMD Health Professional Network, and general population Internet panels operated by Dynata.
Table 1S. Influenza vaccination coverage among health care personnel, by selected characteristics: a comparison of estimates based on the two approaches for weights calculation* — Internet panel survey United States, 2019–20 influenza season.
| Old weights | New weights | |||
| Number (weighted %) | Weighted % vaccinated
(95% CI) |
Number (weighted %) | Weighted % vaccinated
(95% CI) |
|
| Total/Overall | 2,401 | 80.6 (78.2, 82.8) | 2,401 | 80.7 (76.9, 84.6) |
| Age | ||||
| 18-30 years | 371 (18.8) | 83.9 (78.0, 88.7) | 371 (20.8) | 81.0 (70.7, 91.4) |
| 30-45 years | 981 (38.3) | 78.2 (73.8, 82.1) | 981 (35.6) | 79.9 (74.1, 85.7) |
| 45-60 years | 714 (28.7) | 79.5 (75.1, 83.5) | 714 (29.6) | 79.1 (71.6, 86.5) |
| 60+ years | 335 (14.2) | 84.8 (79.5, 89.2) | 335 (14.1) | 86.0 (78.0, 93.9) |
| Race/ethnicity‡ | ||||
| White, non-Hispanic | 1,494 (61.1) | 82.6 (79.9, 85.2) | 1,494 (59.5) | 84.7 (80.7, 88.7) |
| Black, non-Hispanic | 302 (14.6) | 73.6 (66.0, 80.2) | 302 (17.0) | 71.0 (58.8, 83.3) |
| Hispanic | 334 (14.8) | 82.7 (75.2, 88.7) | 334 (14.1) | 77.1 (64.7, 89.6) |
| Other, non-Hispanic | 269 (9.6) | 75.0 (65.1, 83.3) | 269 (9.4) | 78.7 (66.2, 91.3) |
| Education | ||||
| Some college education or less(ref) | 541 (26.2) | 70.4 (65.1, 75.4) | 541 (22.9) | 66.4 (57.7, 75.0) |
| Associate or bachelor’s degree | 804 (46.1) | 85.0 (81.7, 88.0) | 804 (49.2) | 87.8 (83.8, 91.9) |
| More than college degree | 1,056 (27.7) | 82.8 (78.1, 86.8) | 1,056 (27.9) | 80.1 (71.7, 88.4) |
| Occupation§ | ||||
| Physician | 236 (3.2) | 98.0 (95.3, 99.4) | 236 (3.5) | 91.2 (70.0, 99.1) † |
| Nurse practitioner/ Physician assistant | 136 (1.2) | 88.8 (80.9, 94.2) | 136 (1.3) | 90.8 (69.8, 99.0) † |
| Nurse | 174 (18.3) | 92.0 (86.9, 95.5) | 174 (18.5) | 92.5 (88.3, 96.8) |
| Pharmacist | 304 (1.3) | 90.8 (86.6, 94.0) | 304 (1.3) | 96.3 (91.3, 98.9) |
| Other clinical personnel¶ | 577 (20.5) | 81.0 (75.7, 85.5) | 577 (18.6) | 87.5 (80.8, 94.2) |
| Assistant/aide | 614 (23.8) | 72.4 (68.3, 76.1) | 614 (24.3) | 75.5 (70.4, 80.7) |
| Non-clinical personnel|| | 316 (31.7) | 76.7 (71.0, 81.9) | 316 (32.6) | 71.9 (62.4, 81.4) |
| Work setting** | ||||
| Hospital | 767 (37.5) | 93.2 (89.9, 95.6) | 767 (36.8) | 92.1 (88.3, 96.0) |
| Ambulatory care | 693 (27.1) | 78.8 (74.1, 82.9) | 693 (22.1) | 79.8 (74.0, 85.6) |
| Long-term care facility/
home health care†† |
569 (28.5) | 69.3 (64.1, 74.2) | 569 (41.1) | 73.8 (65.5, 82.0) |
| Other clinical setting‡‡ | 703 (16.9) | 77.7 (71.1, 83.5) | 703 (11.7) | 72.2 (61.6, 82.8) |
| Location of primary workplace§§ | ||||
| Rural | 283 (11.8) | 78.4 (71.7, 84.1) | 283 (10.7) | 66.8 (49.5, 81.3)† |
| Non-rural | 2,118 (88.2) | 80.9 (78.3, 83.3) | 2118 (89.3) | 82.4 (78.2, 86.1) |
| Region¶¶ | ||||
| Northeast | 455 (19.1) | 80.5 (74.5, 85.6) | 455 (19.8) | 81.4 (71.2, 89.2) |
| Midwest | 370 (22.0) | 80.6 (75.2, 85.2) | 370 (23.4) | 84.2 (75.7, 90.6) |
| South | 1,016 (36.4) | 80.5 (76.4, 84.2) | 1,016 (36.1) | 79.4 (70.7, 86.4) |
| West | 560 (22.6) | 80.8 (75.7, 85.3) | 560 (20.7) | 78.6 (70.6, 85.3) |
| Employer influenza vaccination requirement | ||||
| Required | 960 (44.2) | 94.4 (91.4, 96.6) | 960 (42.4) | 95.0 (90.0, 98.0) |
| Recommended | 918 (37.0) | 81.6 (77.6, 85.1) | 918 (39.7) | 78.6 (70.8, 85.2) |
| Not required or recommended | 523 (18.8) | 46.2 (40.2, 52.2) | 523 (17.9) | 51.6 (38.0, 65.1) |
*Old way of the weights calculation controls for only the main effects (occupation, age group, race/Ethnicity, gender, work setting, and Census region).
New way of the weights calculation additionally controls for the interaction terms between occupation and the other main effects.
† Estimate does not meet the National Center for Health Statistic’s standards of reliability. https://www.cdc.gov/nchs/data/series/sr_02/sr02_175.pdf
‡ Race/ethnicity was self-reported. Respondents identified as Hispanic might be of any race. The “Other” race category included Asians, American Indians/Alaska Natives, Native Hawaiians or other Pacific Islanders, and respondents who selected “other” or multiple races.
§ Excludes students.
¶ Other clinical personnel include dentists, allied health professionals, technicians and technologists, emergency technicians, emergency medical technicians, and paramedics.
|| Non-clinical personnel include administrative support staff/manager and non-clinical support staff.
** Respondents could select more than one work setting. Each work setting is represented by a separate variable with two levels.
†† Nursing home, assisted living facility, other LTCF, home health agency, or home health care.
‡‡ Includes dentist office or dental clinic, pharmacy, emergency medical services, and other settings where clinical care or related services were provided to patients.
§ Rurality was defined using ZIP codes where >50% of the population resides in a nonmetropolitan county, a rural U.S. Census tract, or both, according to the Health Resources and Services Administration’s definition of rural population. https://www.hrsa.gov/rural-health/about-us/definition/index.html.
¶¶ Northeast: Connecticut, Maine, Massachusetts, New Hampshire, New Jersey, New York, Pennsylvania, Rhode Island, and Vermont. Midwest: Illinois, Indiana, Iowa, Kansas, Michigan, Minnesota, Missouri, Nebraska, North Dakota, Ohio, South Dakota, and Wisconsin. South: Alabama, Arkansas, Delaware, District of Columbia, Florida, Georgia, Kentucky, Louisiana, Maryland, Mississippi, North Carolina, Oklahoma, South Carolina, Tennessee, Texas, Virginia, and West Virginia. West: Alaska, Arizona, California, Colorado, Hawaii, Idaho, Montana, Nevada, New Mexico, Oregon, Utah, Washington, and Wyoming.
Table 2S. Attitude towards Influenza vaccination: weighted percent responded and percent † vaccinated among health care personnel ─ Internet panel surveys*, Unites States, April 2021.
| Agree/Strongly agree | Disagree/Strongly disagree | |||
| Attitude | Number (weighted %) | Weighted % vaccinated (95% CI) | Number (weighted %) | Weighted % vaccinated (95% CI) |
| HCP should be required to be vaccinated | 1,636 (62.4) | 89.7 (86.2, 92.5) | 755 (37.6) | 53.0 (44.5, 61.4) |
| Getting vaccine is worth time and expense | 2,077 (81.4) | 87.7 (84.8, 90.2) | 313 (18.6) | 24.1 (15.5, 34.6) |
| Flu is a serious threat to my health | 1,247 (49.9) | 85.5 (79.2, 90.5) | 1,144 (50.1) | 66.3 (59.3, 72.8) |
| Vaccination can protect me from flu | 2,046 (81.1) | 84.7 (79.5, 89.0) | 345 (18.9) | 38.0 (27.9, 48.9) |
| If I get flu vaccine, people around me will be protected | 2,026 (82.3) | 84.2 (78.9, 88.6) | 365 (17.7) | 37.2 (27.8, 47.5) |
| Flu is a threat to health of people around me | 1,878 (76.3) | 84.1 (79.6, 87.9) | 511 (23.7) | 49.5 (38.8, 60.3) |
| Flu vaccination is safe | 2,201 (87.0) | 84.0 (80.7, 87.0) | 189 (13.0) | 21.4 (10.7, 36.1) |
| I am at risk of getting flu | 1,641 (64.2) | 82.8 (77.8, 87.0) | 749 (35.8) | 63.6 (54.1, 72.3) |
| People around me are at risk of getting flu | 1,910 (75.4) | 82.2 (78.0, 86.0) | 481 (24.6) | 56.4 (44.2, 68.0) |
| HCP should be rewarded for getting vaccinated | 1,622 (65.8) | 80.4 (76.0, 84.3) | 768 (34.2) | 67.3 (57.3, 76.2) |
*Percent of HCP who agree or disagree with each attitude and percent of vaccinated among responded to the attitude question were weighted.
† Respondents were recruited from two preexisting national opt-in Internet sources: Medscape, a medical website managed by WebMD Health Professional Network, and general population Internet panels operated by Dynata.