Health Care Personnel and Flu Vaccination, Internet Panel Survey, United States, November 2016
Influenza (flu) among health care personnel (HCP) can result in lost workdays for HCP and can spread to other HCP and to patients who are at higher risk of serious flu complications (1-5).
- Flu vaccination of HCP has been shown to reduce the risk of flu and absenteeism in vaccinated HCP and reduce the risk of respiratory illness and deaths in nursing home residents (2–5).
- The Advisory Committee on Immunization Practices (ACIP) recommends that all HCP receive an annual flu vaccination (1).
- Flu vaccination coverage among HCP has improved over the past six flu seasons, but remains below the national Healthy People 2020 target of 90% (6).
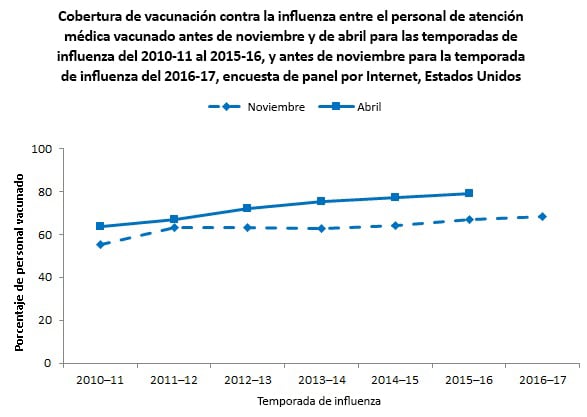
- Flu vaccination coverage among HCP measured using Internet panel surveys* was 77.3% during the 2014–15 season and 79.0% during the 2015–16 season (7).
CDC analyzed data from an Internet panel survey conducted among HCP from October 27 through November 13, 2016. The results of this survey provide information for use in vaccination campaigns during National Influenza Vaccination Week 2016 (December 4–10, 2016). This report provides early (early November) estimates of vaccination coverage among HCP. Final 2016–17 flu season HCP vaccination coverage estimates will be published in September 2017.
Key Findings
- Early-season 2016–17 flu vaccination coverage among HCP was 68.5%, similar to early-season coverage during the 2015–16 season (66.7%).
- During the previous two seasons, flu vaccination coverage increased by 12–13 percentage points from early season to the end of the season.
- By occupation, early-season flu vaccination coverage was highest among physicians (83.0%), nurse practitioners/physician assistants (82.8%), pharmacists (81.4%), nurses (80.7%), and other clinical professionals (72.3%).
- Flu vaccination coverage was lowest among administrative and nonclinical support staff (65.3%) and assistants and aides (56.8%).
- By work setting, early season flu vaccination coverage was highest among HCP working in hospitals (80.8%).
- Flu vaccination coverage continues to be lowest among HCP working in long-term care (LTC) settings (55.1%).
- Early-season flu vaccination coverage was higher among HCP whose employers required (89.3%) or recommended (69.4%) that they be vaccinated compared with HCP whose employer did not have a requirement or a recommendation regarding flu vaccination (26.0%).
- Among unvaccinated HCP who did not intend to get the flu vaccination during this flu season, the most common reason reported for not getting vaccinated was fear of experiencing side effects or getting sick from the vaccine. The second most common reason was that they don’t think that flu vaccines work.
Conclusions/Recommendations:
- Vaccination continues to be low among assistants, aides, nonclinical support staff, and HCP working in LTC settings.
- Providing free, on-site, and actively promoted influenza vaccination in the workplace can lead to improved coverage (8). Efforts to improve HCP coverage are most needed in LTC settings, where residents are at high risk of severe complications from flu.
- The highest vaccination coverage was reported among HCP with an employer requirement for vaccination.
Who Was Vaccinated?
Coverage by Occupation
- Early flu vaccination coverage was higher among physicians (83.0%), nurse practitioners and physician assistants (82.8%), pharmacists (81.4%), nurses (80.7%), and other clinical personnel (72.3%) compared with administrative/nonclinical support staff (65.3%) and assistants or aides (56.8%).
- Flu vaccination coverage in all occupational groups was similar in early-season 2015–16 and early-season 2016–17.

Coverage by Work Setting
- Early flu vaccination coverage varied by work setting and was highest among HCP working in hospitals (80.8%) and lowest among HCP working in long-term care settings (55.1%).
- Coverage among HCP working in “other” settings increased by 7.7 percentage points from early-season 2015–16 to early-season 2016–17. Coverage in all other work settings was similar in early-season 2015–16 and early-season 2016–17.


Coverage by Employer Requirement or Recommendation
- Early flu vaccination coverage was highest among HCP with an employer requirement for vaccination (89.3%). Vaccination coverage was higher among HCP with an employer recommendation for vaccination but no requirement (69.4%) compared with those whose employers had neither a requirement nor a recommendation for vaccination (26.0%).

- HCP working in hospitals were more likely to report an employer requirement for vaccination than HCP working in ambulatory care, long-term care, and other settings (Table 1).
|
Percentage of HCP with an employer requirement for vaccination |
Percentage vaccinated among HCP with and without an employer requirement for vaccination |
|||
|---|---|---|---|---|
|
Required |
Not required |
|||
|
Unweighted n |
Weighted % |
Weighted % |
Weighted % |
|
|
Hospital |
544 |
58.4 |
88.6 |
69.8 |
|
Ambulatory care / Physician office |
314 |
36.1 |
90.3 |
56.5 |
|
Long-term care facility |
149 |
24.3 |
87.4 |
44.7 |
|
Other settingǁ |
152 |
22.0 |
88.1 |
59.8 |
|
Total |
944 |
37.7 |
89.3 |
56.0 |
Place of Vaccination
- Similar to the past six seasons, most vaccinated HCP (80.9%) received the flu vaccination at their workplace.


Main Reason for Not Receiving Vaccination
- Among unvaccinated HCP who reported that they do not intend to get a flu vaccination during this flu season, the most commonly reported reason** was fear of side effects or getting sick from the vaccine.
- Other reasons commonly reported for not receiving a flu vaccination included thinking the flu vaccine does not work and thinking that they do not need the vaccine.

What Can Be Done? (Recommendations)
Overall, the early estimate of flu vaccination coverage among HCP in 2016–17 (68.5%) was similar to early-coverage estimates from 2015–16 (66.7%). Flu vaccination coverage among HCP working in hospital settings was substantially higher than coverage among HCP working in ambulatory, long-term care, and other work settings. On-site vaccination and other successful promotional efforts to increase coverage in hospital settings could be implemented in other work settings with lower coverage.
The top two reasons for not getting vaccinated were thinking flu vaccine was not effective and concern about side effects. HCP should be provided with information about the impact of vaccination, including acknowledgement of the vaccine’s reduced effectiveness during some seasons (such as the 2014–15 season) and the potential for year-to-year variability of the impact of vaccination (9). HCP should also be reminded of the long safety record of the vaccine and the substantial benefits of influenza vaccination in preventing millions of illnesses, tens of thousands of hospitalizations, and thousands or tens of thousands of deaths each year (10). Interventions to promote flu vaccination among HCP each season include:
- Employers should offer flu vaccination to HCP:
- At the worksite over multiple days and shifts,
- Free of charge, and with
- Active promotion.
- Educational materials should be provided to address questions and misperceptions about flu vaccination benefits and risks.
- Employers and health care administrators should make use of the Guide to Community Preventive Services, which provides guidance on effective interventions to increase the uptake of flu vaccination among HCP (8).
- Long-term care (LTC) employers also can use the LTC web-based toolkit developed by CDC and the National Vaccine Program Office, which provides access to resources, strategies, and educational materials for increasing flu vaccination among HCP in LTC settings (11).
- Measurement of and feedback of vaccination coverage are recommended by the Community Preventive Services Task Force to increase uptake of recommended vaccination (8). Measures such as the requirements by the U.S. Centers for Medicare and Medicaid Services (CMS) for acute-care hospitals, ambulatory surgery centers, and outpatient dialysis facilities to report HCP influenza vaccination coverage rates for their facilities may be useful for this purpose (12-15).
The November internet panel survey of HCP is designed to provide estimates of national flu vaccination coverage among HCP and to assess the effectiveness of current vaccination efforts. The follow-up survey will be conducted in April 2017 to provide end-of-season flu vaccination coverage estimates.
Data Source and Methods
CDC collected data from two preexisting web-based panels from October 27 through November 13, 2016. Professional clinical personnel (physicians, nurse practitioners, physician assistants, nurses, dentists, pharmacists, allied health professionals, technicians, technologists, emergency medical technicians, and paramedics) were recruited from the membership of Medscape, a professional health website managed by WebMD Professional Services. HCP in other occupations (assistants, aides, administrative support staff and managers, and nonclinical support staff employed in health care work settings) were recruited from a general-population Internet panel operated by Survey Sampling International. The sample was weighted to reflect the demographic composition of the target population of U.S. HCP. Survey items included vaccination during the current flu season, vaccination history, and knowledge, attitudes, and beliefs concerning flu and flu vaccination. There were 2,530 eligible HCP who started the survey, and 2,490 (98.5%) of those completed the survey. Weighted estimates were calculated based on each occupational group by age, gender, race/ethnicity, health care work setting, and census region to be generalizable to the U.S. population of HCP.
Weighted analyses were conducted using SAS (version 9.2) survey procedures. Because the opt-in Internet panel sample is based on those who self-selected for participation in the panels rather than a random probability sample, statistical measures such as calculation of confidence intervals and tests of differences cannot be performed (16). A change was noted as an increase or decrease when there was a difference in estimates of at least 5 percentage points.
Sample Demographics
- A total of 2,490 HCP were included in the survey.
- By age, 1,644 (66.1%) were 18–49 years, 743 (29.9%) were 50–64 years, and 102 (4.1%) were 65 years and older.‡‡
- For additional occupational characteristics, please see the attached table [18 KB].
- For additional work setting characteristics, please see the attached table [18 KB].
Limitations
These results are preliminary and should be interpreted with caution. The follow-up survey in April 2017 will assess flu vaccination coverage at the end of the flu season.
The findings in the report are subject to several limitations.
- The sample was not necessarily representative of the approximately 18 million HCP in the United States. The survey was conducted among a group of volunteer HCP (a non-probability sample) who had already enrolled in Medscape or the Survey Sampling International panel, rather than among a randomly selected sample.
- Although the sample was weighted to improve representativeness, some bias might remain in estimates given the exclusion of individuals with no Internet access and the self-selection processes for entry into the panels and participation in the survey. Estimates might be biased if the selection processes for entry into the Internet panels and the decision to participate in this particular survey were related to receipt of vaccination.
- All vaccination results are based on self-report and were not verified by employment or medical records.
- The definition of HCP used in this Internet panel survey (persons who worked in a health care setting) might vary from definitions used in other surveys of vaccination coverage among HCP.
- Occupational categories could not always be separated because of small sample sizes, questionnaire design, or other limitations.
- The 2016–17 estimates from this survey might not be directly comparable to estimates from population-based surveys.
- The estimates of flu vaccination coverage among HCP from the Internet panel surveys and the NHIS differed for the 2009–10 (63.4% versus 57.5%), 2010–11 (63.5% versus 55.8%), 2011–12 (66.9% versus 62.4%), 2012–13 (72.0% versus 66.9%), 2013–14 (75.2% versus 65.4%), and 2014-15 seasons (77.3 versus 68.6%) (7,8,18).
Despite these limitations, Internet panel surveys are a useful surveillance tool for timely early season and post-season evaluation of flu vaccination coverage and vaccination-related knowledge, attitude, practice, and barrier data among HCP.
These results are preliminary and should be interpreted with caution. The follow-up survey in April 2017 will assess flu vaccination coverage at the end of the flu season.
The findings in the report are subject to several limitations.
- The sample was not necessarily representative of the approximately 18 million HCP in the United States. The survey was conducted among a group of volunteer HCP (a nonprobability sample) who had already enrolled in Medscape or the Survey Sampling International panel, rather than among a randomly selected sample.
- Although the sample was weighted to improve representativeness, some bias might remain in estimates given the exclusion of individuals with no Internet access and the self-selection processes for entry into the panels and participation in the survey. Estimates might be biased if the selection processes for entry into the Internet panels and the decision to participate in this particular survey were related to receipt of vaccination.
- All vaccination results are based on self-report and were not verified by employment or medical records.
- The definition of HCP (persons who worked in a health care setting) used in this Internet panel survey might vary from definitions used in other surveys of vaccination coverage among HCP.
- Occupational categories could not always be separated because of small sample sizes, questionnaire design, or other limitations.
- The 2016–17 estimates from this survey might not be directly comparable to estimates from population-based surveys.
- The estimates of flu vaccination coverage among HCP from the Internet panel surveys and the NHIS differed for the 2009–10 (63.4% vs. 57.5%), 2010–11 (63.5% vs. 55.8%), 2011–12 (66.9% vs. 62.4%), 2012–13 (72.0% vs. 66.9%), 2013–14 (75.2% vs. 65.4%), and 2014-15 seasons (77.3% vs. 68.6%) (7,17-18). NHIS data for the 2015–16 season are not yet available for comparison.
Despite these limitations, Internet panel surveys are a useful surveillance tool for timely early-season and postseason evaluation of flu vaccination coverage and vaccination-related knowledge, attitude, practice, and barrier data among HCP.
Authors: Carla L. Black, PhD1; Xin Yue, MPS, MS2; Sarah W. Ball, ScD, MPH3; Rebecca Fink, MPH3; David Izrael, MS3; Peng-Jun Lu, MD, PhD1; Walter W. Williams, MD, MPH1; Samuel B. Graitcer, MD1; Carolyn B. Bridges, MD1; Megan C. Lindley, MPH1; Marie A. de Perio, MD4; Stacie M. Greby, DVM, MPH1 1Immunization Services Division, National Center for Immunization and Respiratory Diseases, CDC; 2Leidos, Atlanta, GA; 3Abt Associates Inc., Cambridge, MA; 4Division of Surveillance, Hazard Evaluations, and Field Studies, National Institute for Occupational Safety and Health, CDC
Related Links
- Influenza Vaccination Coverage: FluVaxView
- Influenza Vaccination Coverage Among Health Care Personnel — United States, 2015–16 Influenza Season
- Health Care Personnel and Flu Vaccination, Internet Panel Survey, United States, November 2015
- Influenza Vaccination Coverage Among Health Care Personnel — United States, 2014–15 Influenza Season
- Health Care Personnel and Flu Vaccination, Internet Panel Survey, United States, November 2014
- Influenza Vaccination Coverage Among Health Care Personnel — United States, 2013–14 Influenza Season
- Health Care Personnel and Flu Vaccination, Internet Panel Survey, United States, November 2013
- Influenza Vaccination Coverage Among Health-Care Personnel — United States, 2012–13 Influenza Season
- Health Care Personnel Flu Vaccination, Internet Panel Survey, United States, November 2012
- Influenza Vaccination Coverage Among Health-Care Personnel — 2011–12 Influenza Season, United States
- Health Care Personnel Flu Vaccination, Internet Panel Survey, United States, November 2011
- Influenza Vaccination Coverage Among Health-Care Personnel — United States, 2010–11 Influenza Season
- Health Care Personnel Flu Vaccination, Internet Panel Survey, United States, November 2010 [326 KB, 5 pages]
- Immunization of Health-Care Personnel: Recommendations of the Advisory Committee on Immunization Practices [ 705 KB, 48 pages]
- Seasonal Influenza (Flu) Information for Health Professionals
- Influenza Vaccination Information for Health Care Workers
- National Influenza Vaccination Week (NIVW) (resources for health professionals and partners)
- A Toolkit for Long-Term Care Employers: Increasing Influenza Vaccination among Health Care Personnel in Long-Term Care Settings
- SSI
- SurveySpot
- Follow CDC Flu on Twitter: @CDCFlu
References/Resources
- C. Immunization of health-care personnel: recommendations of the Advisory Committee on Immunization Practices (ACIP). MMWR Recomm Rep 2011;60(No. RR-7).
- Saxen H, Virtanen M. Randomized, placebo-controlled double blind study on the efficacy of influenza immunization on absenteeism of healthcare workers. Pediatr Infect Dis J. 1999; 18:779-83.
- Oshitani H, Saito R, Seki N, et al. Influenza vaccination levels and influenza-like illness in long-term care facilities for elderly people in Niigata, Japan, during an Influenza A (H3N2) epidemic. Infect Control Hosp Epidemiol 2000;21:728-30.
- Hayward AC, Harling R, Wetten S, et al. Effectiveness of an influenza vaccine programme for care home staff to prevent death, morbidity, and health service use among residents: cluster randomised controlled trial. BMJ 2006;333:1241.
- Lemaitre M, Meret T, Rothan-Tondeur M, et al. Effect of influenza vaccination of nursing home staff on mortality of residents: a cluster-randomized trial. J Am Geriatr Soc. 2009; 57:1580-1586.
- U.S. Department of Health and Human Services, Office of Disease Prevention and Health Promotion. HealthyPeopl 2020. Immunization and Infectious Diseases. Available at https://www.healthypeople.gov/2020/topics-objectives/topic/immunization-and-infectious-diseases/objectives. Accessed November 22, 2016.
- Black CL, Yue X, Ball SW, et al. Influenza vaccination coverage among health care personnel—United States, 2015-16 influenza season. MMWR Morb Mortal Wkly Rep 2016;65:1026-31.
- Community Preventive Services Task Force. Worksite: seasonal influenza vaccinations using interventions with on-site, free, actively promoted vaccinations—healthcare workers. Available at http://www.thecommunityguide.org/worksite/flu-hcw.html. Accessed November 15, 2016.
- Flannery B, Clippard J, Zimmerman RK, et al. Early estimates of seasonal influenza vaccine effectiveness—United States, January 2015. MMWR Morb Mortal Wkly Rep 2015;64:10-15.
- Reed C, Kim IK, Singleton JA, et al. Estimated influenza illnesses and hospitalizations averted by vaccination—United States, 2013–14 influenza season. MMWR Morb Moral Wkly Rep 2014;63:1151-4.
- CDC. A toolkit for long-term care employers: increasing influenza vaccination among health care personnel in long-term care settings. Available at https://www.cdc.gov/flu/toolkit/long-term-care/index.htm. Accessed November 15, 2016.
- U.S. Department of Health and Human Services. Medicare program; hospital inpatient prospective payment systems for acute care hospitals and the long-term care hospital prospective payment system and FY2012 rates; hospitals’ FTE resident caps for graduate medical education payment; final rules. Fed Regist 2011;76:1631-3.
- Lindley MC, Bridges CB, Strikas RA, et al. Influenza vaccination performance measurement among acute care hospital-based health care personnel—United States, 2013–14 influenza season. MMWR 2014;63:812-5.
- U.S. Department of Health and Human Services. Medicare and Medicaid programs; hospital outpatient prospective payment; ambulatory surgical center payment; hospital value-based purchasing program; physician self-referral; and patient notification requirements in provider agreements; final rules. Fed Regist 2011;76:74470-2.
- U.S. Department of Health and Human Services. Medicare Program; end–stage renal disease prospective payment system quality incentive program and durable medical equipment, prosthetics, orthotics, and supplies; final rule. Fed Regist 2014;79:66206-8.
- American Association for Public Opinion Research. Report of the AAPOR Task Force on non-probability sampling. Available at https://www.aapor.org/AAPOR_Main/media/MainSiteFiles/NPS_TF_Report_Final_7_revised_FNL_6_22_13.pdf. Accessed November 9, 2015.
- DC. Surveillance of influenza vaccination coverage – United States, 2007-08 through 2011-12 influenza seasons. MMWR Surveill Summ 2013;62(No. SS-04):1-29.
- Williams WW, Lu PJ, O’Halloran A, et al. Surveillance of vaccination coverage among adult populations—United States, 2015. MMWR Surveill Summ 2017 (in press).
Footnotes
* HCP vaccination coverage based on data from the National Health Interview Survey (NHIS), the data source used to monitor the Healthy People 2020 objective, was 68.6% in the 2014–15 flu season (18). The methods used in the Internet panel survey differ from those of the NHIS; thus, results from the Internet panel survey should not be directly compared to the Healthy People 2020 target.
† 30 students are included in the overall HCP sample but are not included in any occupation category.
‡ Includes allied health professionals, dentists, technicians, technologists, emergency medical technicians, and paramedics.
§ Respondents could specify working in more than one setting. ǁ Includes dental offices, pharmacies, emergency medical service locations, and other health care settings.
¶ Single main reason.
** Among respondents, 25.8% initially selected “I just don’t want the vaccine” as their main reason for not being vaccinated. When these persons were asked in a follow-up question to identify a more specific reason for not wanting the vaccine, 37.1% replied, “I don’t need it,” 35.9% said, “I don’t think the ingredients in the vaccine are good for you,” 15.1% said, “I think that flu vaccines don’t work,” and 12.0% said, “I might get sick from the vaccine.”
†† Includes respondents who have not received the flu vaccine since July 2016 and who reported that they probably or definitely do not intend to be vaccinated in the 2016–17 flu season.
‡‡ Age was not available for one respondent.
Top of Page