FluView Summary ending on October 31, 2020

All data are preliminary and may change as more reports are received.
A description of the CDC influenza surveillance system, including methodology and detailed descriptions of each data component is available on the surveillance methods page.
Additional information on the current and previous influenza seasons for each surveillance component are available on FluView Interactive.
I am text block. Click edit button to change this text. Lorem ipsum dolor sit amet, consectetur adipiscing elit. Ut elit tellus, luctus nec ullamcorper mattis, pulvinar dapibus leo.
Seasonal influenza activity in the United States remains low.
Viruses

Severe Disease
All data are preliminary and may change as more reports are received.
A description of the CDC influenza surveillance system, including methodology and detailed descriptions of each data component is available on the surveillance methods page.
Additional information on the current and previous influenza seasons for each surveillance component are available on FluView Interactive.
Key Points
- An annual flu vaccine is the best way to protect against flu and its potentially serious complications.
- If you haven’t gotten your flu vaccine yet, get vaccinated now.
- There are also flu antiviral drugs that can be used to treat flu illness.
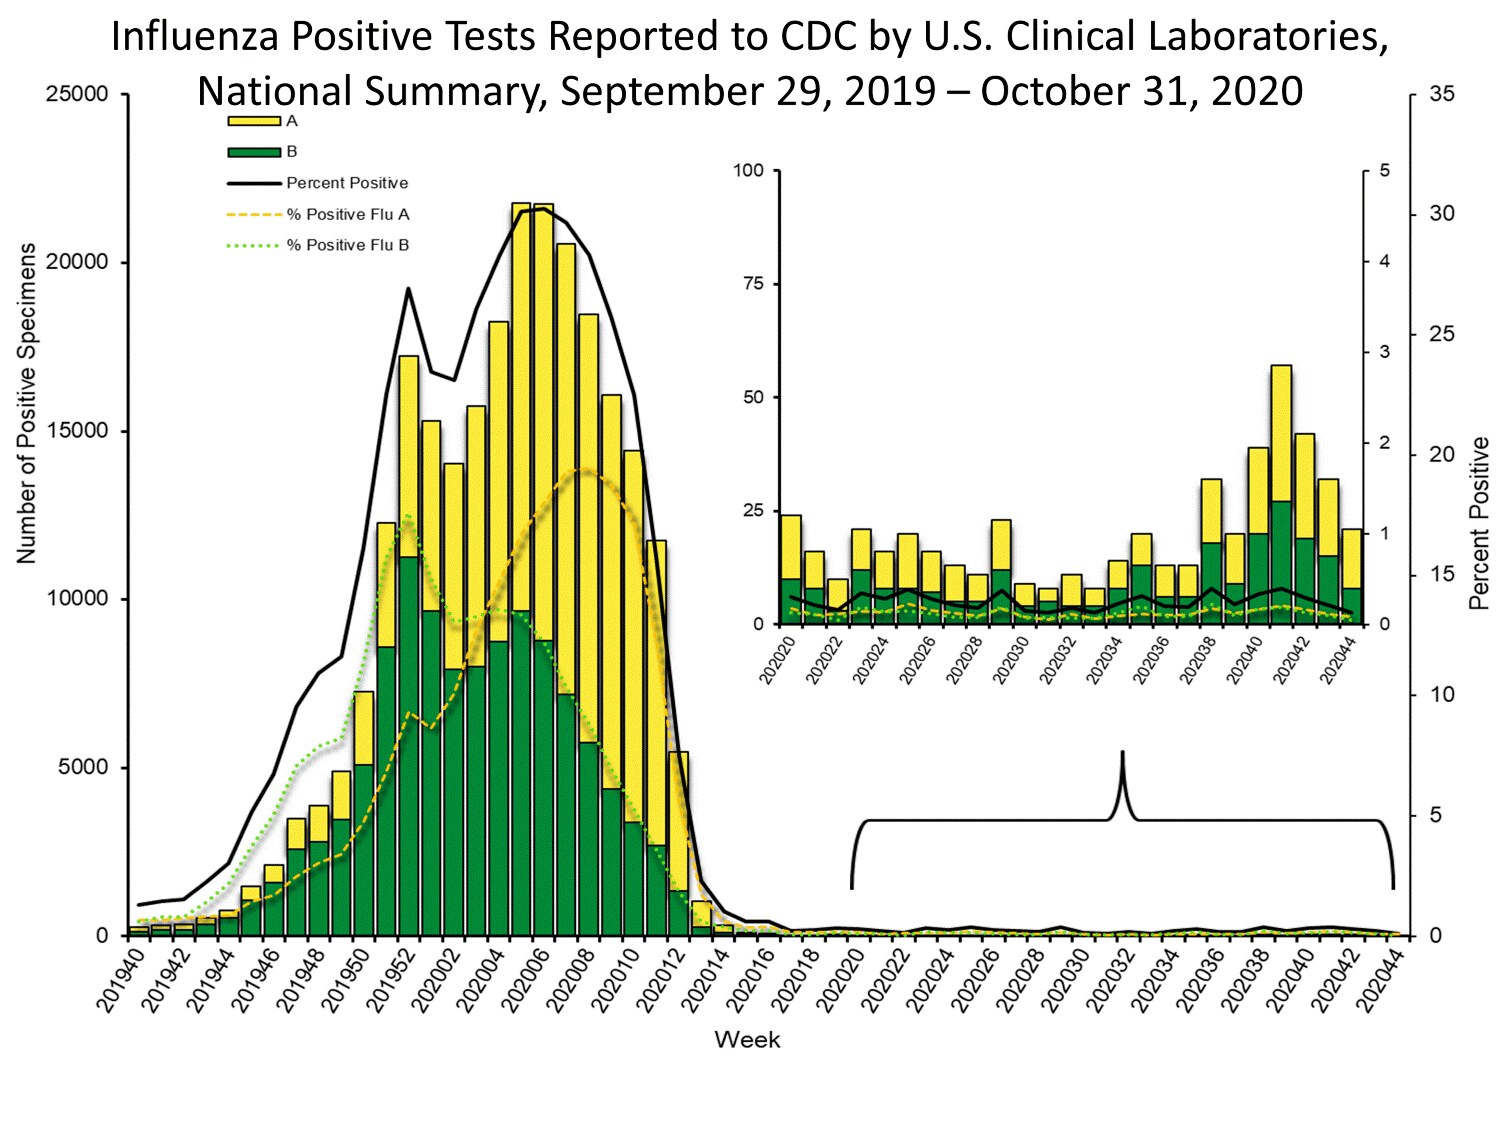
U.S. Virologic Surveillance:
Clinical Laboratories
The results of tests performed by clinical laboratories nationwide are summarized below. Data from clinical laboratories (the percentage of specimens tested that are positive for influenza) are used to monitor whether influenza activity is increasing or decreasing.
| Week 44 | Data Cumulative since September 27, 2020 (Week 40) |
|
|---|---|---|
| No. of specimens tested | 16,456 | 71,814 |
| No. of positive specimens (%) | 21 (0.1%) | 191 (0.3%) |
| Positive specimens by type | ||
| Influenza A | 13 (61.9%) | 102 (53.4%) |
| Influenza B | 8 (38.1%) | 89 (46.6%) |
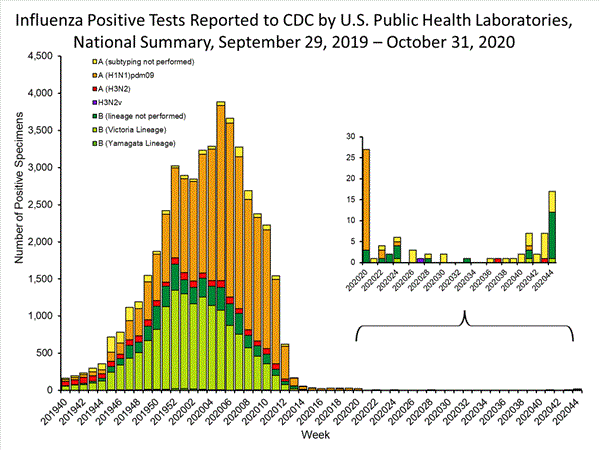
Public Health Laboratories
The results of tests performed by public health laboratories nationwide are summarized below. Data from public health laboratories are used to monitor the proportion of circulating viruses that belong to each influenza subtype/lineage.
| Week 44 | Data Cumulative since September 27, 2020 (Week 40) |
|
|---|---|---|
| No. of specimens tested | 16,139 | 57,877 |
| No. of positive specimens | 17 | 35 |
| Positive specimens by type/subtype | ||
| Influenza A | 5 (29.4%) | 20 (57.1%) |
| (H1N1)pdm09 | 0 (0.0%) | 1 (50.0%) |
| H3N2 | 0 (0.0%) | 1 (50.0%) |
| Subtyping not performed | 5 | 18 |
| Influenza B | 12 (70.6%) | 15 (42.9%) |
| Yamagata lineage | 0 (0.0%) | 0 (0.0%) |
| Victoria lineage | 1 (100.0%) | 2 (100%) |
| Lineage not performed | 11 | 13 |
While influenza B/Victoria viruses predominated earlier in the season, during recent weeks, influenza A(H1N1)pdm09 viruses have been reported more frequently than B/Victoria viruses nationally and in all surveillance regions. For the season, A(H1N1)pdm09 viruses are the predominant virus nationally. Regional and state level data about circulating influenza viruses can be found on FluView Interactive.
The predominant virus also varies by age group. Nationally, for the season overall, influenza B viruses are the most commonly reported influenza viruses among persons 5-24 years, while influenza A viruses are the most commonly reported influenza viruses among persons 0-4 years and 25 years and older. In the most recent three weeks, influenza A viruses are the most commonly reported influenza viruses in all age groups.
Additional virologic surveillance information for current and past seasons:
Surveillance Methods | FluView Interactive: National, Regional, and State Data or Age Data
Influenza Virus Characterization
CDC performs genetic and antigenic characterization of U.S. viruses submitted from state and local health laboratories using Right Size Roadmap submission guidance. These data are used to compare how similar the currently circulating influenza viruses are to the reference viruses representing viruses contained in the current influenza vaccines and to monitor evolutionary changes that continually occur in influenza viruses circulating in humans. CDC also tests susceptibility of influenza viruses to antiviral medications including the neuraminidase inhibitors (oseltamivir, zanamivir, and peramivir) and the PA endonuclease inhibitor baloxavir.
Virus characterization data will be updated weekly starting later this season when a sufficient number of specimens have been tested.
CDC genetically characterized 2,463 influenza viruses collected in the U.S. from September 29, 2019, to April 4, 2020.
| Virus Subtype or Lineage | Genetic Characterization | ||||
|---|---|---|---|---|---|
| Total No. of Subtype/Lineage Tested |
Clade | Number (% of subtype/lineage tested) |
Subclade | Number (% of subtype/lineage tested) |
|
| A/H1 | 896 | ||||
| 6B.1A | 896 (100%) | ||||
| A/H3 | 510 | ||||
| 3C.2a | 480 (94.1%) | 2a1 | 480 (94.1%) | ||
| 2a2 | 0 | ||||
| 2a3 | 0 | ||||
| 2a4 | 0 | ||||
| 3C.3a | 31 (5.9%) | 3a | 31 (5.9%) | ||
| B/Victoria | 965 | ||||
| V1A | 965 (100%) | V1A | 0 | ||
| V1A.1 | 60 (6.2%) | ||||
| V1A.3 | 905 (93.8%) | ||||
| B/Yamagata | 92 | ||||
| Y3 | 92 (100%) | ||||
CDC antigenically characterizes a subset of influenza viruses by hemagglutination inhibition (HI) or neutralization based Focus Reduction assays (FRA). Antigenic drift is evaluated by comparing antigenic properties of cell-propagated reference viruses representing currently recommended vaccine components with those of cell-propagated circulating viruses. CDC antigenically characterized 547 influenza viruses collected in the United States from September 29, 2019, to April 4, 2020. These data are not used to make calculations about vaccine effectiveness (VE). CDC conducts VE studies each year to measure the benefits of flu vaccines in people.
Influenza A Viruses
- A (H1N1)pdm09: 212 A(H1N1)pdm09 viruses were antigenically characterized by HI with ferret antisera, and 175 (82.5%) were antigenically similar (reacting at titers that were within 4-fold of the homologous virus titer) to cell-propagated A/Brisbane/02/2018-like reference viruses representing the A(H1N1)pdm09 component for the 2019-20 Northern Hemisphere influenza vaccines. The decrease in the percent of A(H1N1)pdm09 viruses similar to A/Brisbane/02/2018 is due to some of the recent viruses selected for testing having a single amino acid change that is antigenically distinguishable in antigenic assays using ferret sera. Similar viruses were observed last season as well and these represented a small proportion of virus circulating. We have observed an increase in the proportion of H1N1pdm09 viruses with this change late in the US season.
- A (H3N2): 86 A(H3N2) viruses were antigenically characterized by FRA with ferret antisera, and 40 (46.5%) were antigenically similar to cell-propagated A/Kansas/14/2017-like reference viruses representing the A(H3N2) component for the 2019-20 Northern Hemisphere influenza vaccines.
Influenza B Viruses
- B/Victoria: 201 B/Victoria lineage viruses, including viruses from both co-circulating sub-clades, were antigenically characterized by HI with ferret antisera, and 120 (59.7%) were antigenically similar to cell-propagated B/Colorado/06/2017-like reference viruses representing the B/Victoria component for the 2019-20 Northern Hemisphere influenza vaccines.
- B/Yamagata: 48 B/Yamagata lineage viruses were antigenically characterized by HI with ferret antisera, and all 48 (100%) were antigenically similar to cell-propagated B/Phuket/3073/2013-like reference viruses representing the B/Yamagata component for the 2019-20 Northern Hemisphere influenza vaccines.
CDC also assesses susceptibility of influenza viruses to the antiviral medications including the neuraminidase inhibitors (oseltamivir, zanamivir, and peramivir) and the PA endonuclease inhibitor baloxavir using next generation sequence analysis supplemented by laboratory assays. Viruses collected in the United States since September 29, 2019, were tested for antiviral susceptibility as follows:
| Antiviral Medication | Total Viruses* |
A/H1 | A/H3 | B/Victoria | B/Yamagata | ||
|---|---|---|---|---|---|---|---|
| Neuraminidase Inhibitors |
|||||||
| Oseltamivir | Viruses Tested |
2,433 | 885 | 502 | 954 | 92 | |
| Reduced Inhibition |
1 (0.04%) | (0.0%) | (0.0%) | 1 (0.1%) | (0.0%) | ||
| Highly Reduced Inhibition |
4 (0.2%) | 4 (0.5%) | (0.0%) | (0.0%) | (0.0%) | ||
| Peramivir | Viruses Tested |
2,433 | 885 | 502 | 954 | 92 | |
| Reduced Inhibition |
(0.0%) | (0.0%) | (0.0%) | (0.0%) | (0.0%) | ||
| Highly Reduced Inhibition |
5 (0.2%) | 4 (0.5%) | (0.0%) | 1 (0.1%) | (0.0%) | ||
| Zanamivir | Viruses Tested |
2,433 | 885 | 502 | 954 | 92 | |
| Reduced Inhibition |
2 (0.1%) | (0.0%) | (0.0%) | 2 (0.2%) | (0.0%) | ||
| Highly Reduced Inhibition |
(0.0%) | (0.0%) | (0.0%) | (0.0%) | (0.0%) | ||
| PA Endonuclease Inhibitor | Baloxavir | Viruses Tested |
2,541 | 884 | 584 | 978 | 95 |
| Reduced Susceptibility |
(0.0%) | (0.0%) | (0.0%) | (0.0%) | (0.0%) | ||
* Six influenza viruses showed reduced or highly reduced inhibition by at least one neuraminidase inhibitor. Four A(H1N1)pdm09 viruses showed highly reduced inhibition to oseltamivir and peramivir while showing normal inhibition to zanamivir. In addition, one B/Victoria virus showed highly reduced inhibition to peramivir and reduced inhibition to oseltamivir and zanamivir, while another influenza B/Victoria virus showed reduced inhibition to zanamivir.
A total of 556 additional viruses (211 A(H1N1)pdm09, 32 A(H3N2), and 313 B) collected in Alabama, Alaska, Florida, Illinois, Iowa, Louisiana, Massachusetts, Michigan, Nevada, New York, North Carolina, Pennsylvania, South Dakota, Virginia and Wisconsin were analyzed for resistance to neuraminidase inhibitors by pyrosequencing assay. Three (1.4%) of the 211 A(H1N1)pdm09 viruses tested had the H275Y amino acid substitution in the neuraminidase and showed highly reduced inhibition by oseltamivir and peramivir. No molecular markers associated with reduced or highly reduced inhibition by neuraminidase inhibitors were detected in A(H3N2) and type B viruses tested.
Novel Influenza A Virus
One human infection with a novel influenza A virus was reported by Hawaii. This person was infected with an influenza A(H3N2) variant (A(H3N2)v) virus. The patient is a child < 18 years of age, was not hospitalized, and has recovered from their illness. While no exposure to swine has been reported to date, an investigation is ongoing into the source of the patient’s infection. This is the first influenza A(H3N2)v virus infection detected in the United States since 2018.
Influenza viruses that circulate in swine are called swine influenza viruses when isolated from swine, but are called variant viruses when isolated from humans. Seasonal influenza viruses that circulate worldwide in the human population have important antigenic and genetic differences from influenza viruses that circulate in swine.
Early identification and investigation of human infections with novel influenza A viruses are critical so that the risk of infection can be more fully understood and appropriate public health measures can be taken. Additional information on influenza in swine, variant influenza infection in humans, and strategies to interact safely with swine can be found at http://www.cdc.gov/flu/swineflu/index.htm.
Additional information regarding human infections with novel influenza A viruses can be found at http://gis.cdc.gov/grasp/fluview/Novel_Influenza.html.
Outpatient Illness Surveillance
ILINet
Nationwide during week 44, 1.3% of patient visits reported through the U.S. Outpatient Influenza-like Illness Surveillance Network (ILINet) were due to influenza-like illness (ILI). This percentage is below the national baseline of 2.6%.
Healthcare seeking behaviors have changed dramatically during the COVID-19 pandemic. While outpatient ILI activity remains low, many people are accessing the healthcare system in alternative settings. Therefore, while traditional healthcare providers are not seeing increased numbers of cases of ILI, it is important to evaluate other sources of surveillance data to obtain a complete and accurate picture of both COVID-19 and influenza activity. CDC is tracking the COVID-19 pandemic in a weekly publication called COVIDView.
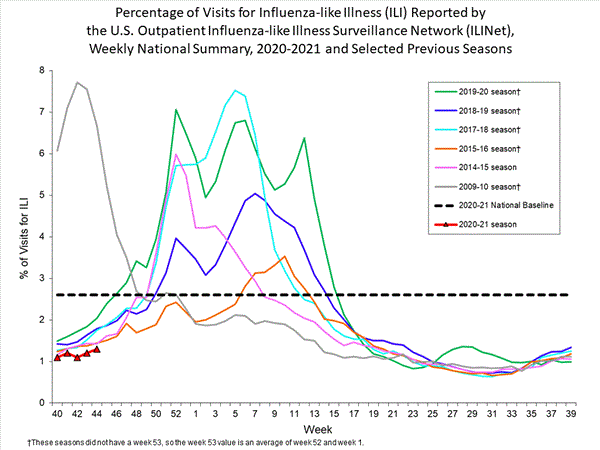
On a regional level, the percentage of outpatient visits for ILI ranged from 1.9% to 7.8% during week 40. All regions reported a percentage of outpatient visits for ILI below their region-specific baselines.
ILI Activity Map
Data collected in ILINet are used to produce a measure of ILI activity* by state/jurisdiction and Core Based Statistical Areas (CBSA).
| Activity Level | Number of Jurisdictions | Number of CBSAs | ||
|---|---|---|---|---|
| Week 44
(Week ending |
Week 43
(Week ending |
Week 44
(Week ending |
Week 43
(Week ending |
|
| Very High | 0 | 0 | 0 | 0 |
| High | 0 | 0 | 2 | 1 |
| Moderate | 1 | 0 | 4 | 1 |
| Low | 1 | 1 | 38 | 27 |
| Minimal | 52 | 53 | 544 | 567 |
| Insufficient Data | 0 | 0 | 341 | 333 |
*Data collected in ILINet may disproportionally represent certain populations within a jurisdiction or CBSA, and therefore, may not accurately depict the full picture of influenza activity for the entire jurisdiction or CBSA. Differences in the data presented here by CDC and independently by some health departments likely represent differing levels of data completeness with data presented by the health department likely being the more complete.
Additional information about medically attended visits for ILI for current and past seasons:
Surveillance Methods | FluView Interactive: National, Regional, and State Data or ILI Activity Map
Geographic Spread of Influenza as Assessed by State and Territorial Epidemiologists
The geographic spread of influenza as reported by state and territorial epidemiologists indicates geographic spread of influenza viruses but does not measure the severity of influenza activity. Due to the impact of COVID-19 on ILI surveillance, and the fact that the state and territorial epidemiologists report relies heavily on ILI activity, reporting for this system will be suspended for the 2020-21 influenza season. Data from previous seasons is available on FluView Interactive.
Additional geographic spread surveillance information for current and past seasons:
Surveillance Methods | FluView Interactive
Influenza-Associated Hospitalizations:
The Influenza Hospitalization Surveillance Network (FluSurv-NET) conducts population-based surveillance for laboratory-confirmed influenza-related hospitalizations in select counties in the Emerging Infections Program (EIP) states and Influenza Hospitalization Surveillance Project (IHSP) states. FluSurv-NET estimated hospitalization rates will be updated weekly starting later this season.
The highest rate of hospitalization is among adults aged ≥ 65, followed by children aged 0-4 years and adults aged 50-64 years.
| Age Group | 2019-2020 Season Cumulative Rate per 100,000 Population |
|---|---|
| Overall | 68.2 |
| 0-4 years | 94.1 |
| 5-17 years | 24.6 |
| 18-49 years | 35.6 |
| 50-64 years | 90.2 |
| 65+ years | 179.7 |
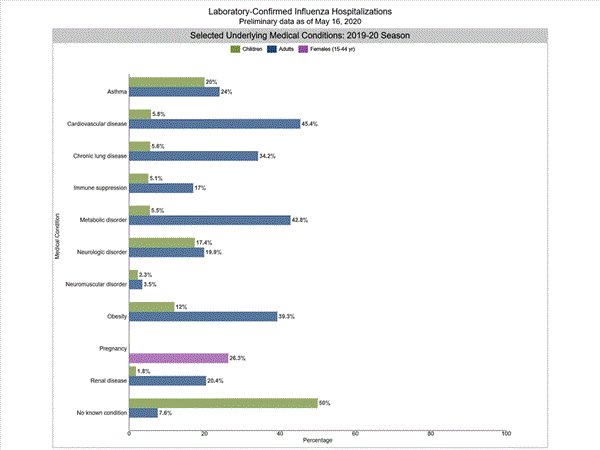
Among 3,433 hospitalized adults with information on underlying medical conditions, 92.3% had at least one reported underlying medical condition, the most commonly reported were cardiovascular disease, metabolic disorder, obesity, and chronic lung disease. Among 569 hospitalized children with information on underlying medical conditions, 48.5% had at least one underlying medical condition; the most commonly reported was asthma. Among 600 hospitalized women of childbearing age (15-44 years) with information on pregnancy status, 27.2% were pregnant.
Additional hospitalization surveillance information for current and past seasons and additional age groups:
Surveillance Methods | FluView Interactive: Rates by Age or Patient Characteristics
National Center for Health Statistics (NCHS) Mortality Surveillance
Based on NCHS mortality surveillance data available on November 5, 2020, 8.1% of the deaths occurring during the week ending October 31, 2020 (week 44), were due to pneumonia, influenza, and COVID-19 (PIC). This percentage is above the epidemic threshold of 6.0% for week 44.
Weekly mortality surveillance data include a combination of machine coded and manually coded causes of death collected from death certificates. Percentages of deaths due to pneumonia, influenza, or COVID-19 (PIC) are higher among manually coded records than more rapidly available machine coded records. Due to the additional time needed for manual coding, the initially reported PIC percentages are likely to increase as more data are received and processed.
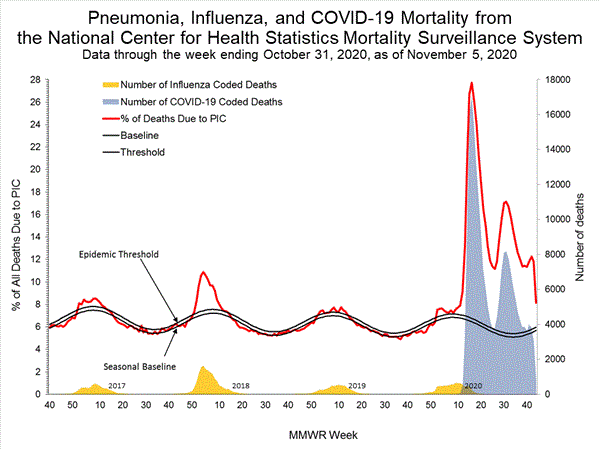
While the percent of all deaths due to P&I has increased during weeks 9-13 (7.4-10.0%), the percent of all deaths with Influenza listed as a cause have decreased (from 1.0% to 0.7%) over this same time period. The increase in pneumonia deaths during this time period are likely associated with COVID-19 rather than influenza.
Additional pneumonia and influenza mortality surveillance information for current and past seasons:
Surveillance Methods | FluView Interactive
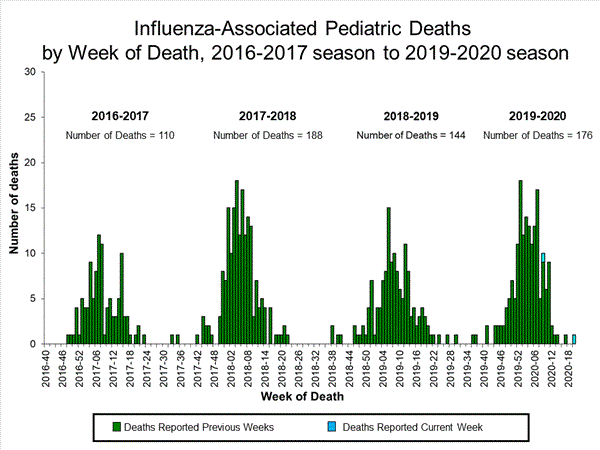
Influenza-Associated Pediatric Mortality
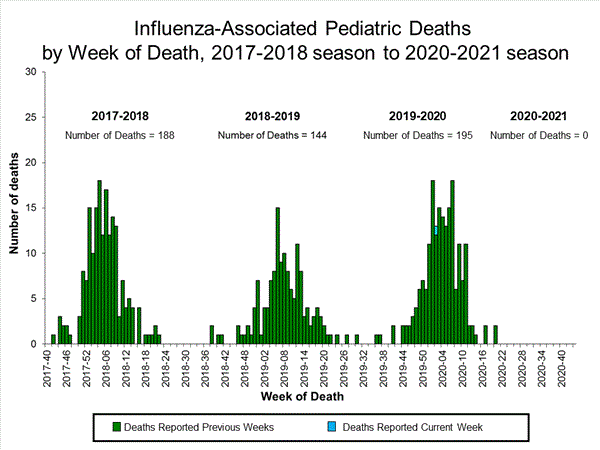
No influenza-associated pediatric deaths occurring during the 2020-21 season have been reported to CDC.
One influenza-associated pediatric death was reported to CDC during week 44. This death occurred during the 2019-2020 influenza season bringing the total number of deaths occurring during that season to 195. It was associated with an influenza B virus with no lineage determined and occurred during week 2 (the week ending January 11, 2020).
Additional pediatric mortality surveillance information for current and past seasons:
Surveillance Methods | FluView Interactive
Additional National and International Influenza Surveillance Information
FluView Interactive: FluView includes enhanced web-based interactive applications that can provide dynamic visuals of the influenza data collected and analyzed by CDC. These FluView Interactive applications allow people to create customized, visual interpretations of influenza data, as well as make comparisons across flu seasons, regions, age groups and a variety of other demographics.
National Institute for Occupational Safety and Health: Monthly surveillance data on the prevalence of health-related workplace absenteeism among full-time workers in the United States are available from NIOSH.
U.S. State and local influenza surveillance: Select a jurisdiction below to access the latest local influenza information.
World Health Organization:
Additional influenza surveillance information from participating WHO member nations is available through
FluNet and the Global Epidemiology Reports.
WHO Collaborating Centers for Influenza:
Australia, China, Japan, the United Kingdom, and the United States (CDC in Atlanta, Georgia)
Europe:
The most up-to-date influenza information from Europe is available from WHO/Europe and the European Centre for Disease Prevention and Control.
Public Health Agency of Canada:
The most up-to-date influenza information from Canada is available in Canada’s weekly FluWatch report.
Public Health England:
The most up-to-date influenza information from the United Kingdom is available from Public Health England.
Any links provided to non-Federal organizations are provided solely as a service to our users. These links do not constitute an endorsement of these organizations or their programs by CDC or the Federal Government, and none should be inferred. CDC is not responsible for the content of the individual organization web pages found at these links.
A description of the CDC influenza surveillance system, including methodology and detailed descriptions of each data component is available on the surveillance methods page.
