Update: Influenza Activity — United States, October 2–December 17, 2016
Weekly / December 30, 2016 / 65(5051);1439–1444
Mei Shang, MBBS, MPH1,2; Lenee Blanton, MPH2; Krista Kniss, MPH2; Desiree Mustaquim, MPH2; Noreen Alabi, MPH2; Stephen Barnes, MPH2; Alicia Budd, MPH2; Stacy L. Davlin, PhD2; Natalie Kramer2; Shikha Garg, MD2; Charisse N. Cummings, MPH2; Brendan Flannery, PhD2; Alicia M. Fry, MD2; Lisa A. Grohskopf, MD2; Sonja J. Olsen, PhD2; Joseph Bresee, MD2; Wendy Sessions, MPH2; Rebecca Garten, PhD2; Xiyan Xu, MD2; Anwar Isa Abd Elal2; Larisa Gubareva, PhD2; John Barnes, PhD2; David E. Wentworth, PhD2; Erin Burns, MA2; Jacqueline Katz, PhD2; Daniel Jernigan, MD2; Lynnette Brammer, MPH2 (View author affiliations)
View suggested citationSummary
What is already known about this topic?
CDC collects, compiles, and analyzes data on influenza activity year-round in the United States. The influenza season generally begins in the fall and continues through the winter and spring months; however, the timing and severity of circulating influenza viruses can vary by geographic location and season.
What is added by this report?
During October 2–December 17, 2016, influenza activity remained low in October but has been slowly increasing since November in the United States. Influenza A (H3N2) viruses were the most frequently identified viruses. Almost all viruses characterized thus far this season have been similar to the components of the 2016–17 Northern Hemisphere trivalent and quadrivalent influenza vaccine formulations. All influenza viruses tested to date have been sensitive to the antiviral drugs oseltamivir, zanamivir, and peramivir.
What are the implications for public health practice?
Vaccination is the primary method to prevent influenza illness and its complications. Health care providers should continue to recommend influenza vaccination to all unvaccinated persons aged ≥6 months now and throughout the influenza season. As an adjunct to vaccine, treatment with influenza antiviral medications is recommended for patients with confirmed or suspected influenza who have severe, complicated, or progressive illness; who require hospitalization; or who are at high risk for influenza-related complications. Antivirals can lessen severity and duration of illness and can reduce severe outcomes of influenza. Antiviral medications work best when administered early in the course of influenza illness.
Altmetric:
This report summarizes U.S. influenza activity* during October 2–December 17, 2016.† Influenza activity in the United States remained low in October and has been slowly increasing since November. Influenza A viruses were identified most frequently, with influenza A (H3N2) viruses predominating. Most influenza viruses characterized during this period were genetically or antigenically similar to the reference viruses representing vaccine components recommended for production in the 2016–17 Northern Hemisphere influenza vaccines.
Virologic Surveillance
U.S. World Health Organization (WHO) and National Respiratory and Enteric Virus Surveillance System (NREVSS) laboratories include both clinical and public health laboratories throughout the United States that carry out virologic surveillance for influenza. During October 2–December 17, 2016, clinical laboratories in the United States tested 177,867 respiratory specimens for influenza viruses, 5,157 (2.9%) of which were positive (Figure 1); among identified viruses, 3,786 (73.4%) were influenza A and 1,371 (26.6%) were influenza B. Among influenza positive results reported by clinical laboratories, U.S. Department of Health and Human Services region 4§ (Alabama, Florida, Georgia, Kentucky, Mississippi, North Carolina, South Carolina, and Tennessee) accounted for 2,210 (42.9 %) of all influenza positive results and 911 (66.4 %) of all influenza B viruses reported.
Public health laboratories in the United States tested 12,496 respiratory specimens collected during October 2–December 17, 2016. Among these, 2,103 were positive for influenza (Figure 2), including 1,930 (91.8%) that were positive for influenza A viruses and 173 (8.2%) that were positive for influenza B viruses. Among the 1,824 influenza A specimens subtyped, 95 (5.2%) were influenza A (H1N1)pdm09 and 1,729 (94.8%) were influenza A (H3N2). Among the 97 influenza B viruses for which lineage was determined, 39 (40.2%) belonged to the B/Yamagata lineage and 58 (59.8%) belonged to the B/Victoria lineage. Since October 2, 2016, influenza-positive tests have been reported from all U.S. Department of Health and Human Services regions.
Age was reported for 1,851 influenza-positive patients, among whom 140 (7.6%) were children aged 0–4 years, 608 (32.8%) were aged 5–24 years, 599 (32.4%) were aged 25–64 years, and 504 (27.2%) were aged ≥65 years. Influenza A (H3N2) viruses predominated in each age group, representing a range of 67.9% of influenza positives in persons aged 0–4 years to 86.5% in persons aged ≥65 years.
Novel Influenza A Viruses
One human infection with a novel influenza A virus was reported during October 2–December 17, 2016. The infection was reported by Iowa for the week ending November 19, 2016. The person was infected with an influenza A (H1N2) variant [(H1N2)v] virus¶ and was not hospitalized. Exposure to swine in the week preceding illness was reported, and there was no evidence of ongoing human-to-human transmission of the virus.
Antigenic and Genetic Characterization of Influenza Viruses
WHO collaborating laboratories in the United States are requested to submit a subset of influenza-positive respiratory specimens to CDC for further virus characterization. CDC characterizes influenza viruses through one or more laboratory tests, including genomic sequencing, antigenic characterization by hemagglutination inhibition (HI), and neutralization assays. Historically HI data have been used most commonly to assess the similarity between vaccine viruses and circulating viruses to infer how well the vaccine might work until such time as vaccine effectiveness estimates are available.** For all viruses characterized at CDC laboratories, next-generation sequencing is performed to determine the genetic identity of circulating viruses. For those viruses whose antigens cannot be characterized, their antigenic properties are inferred from viruses with matching genes whose antigen profile is known.
CDC has genetically characterized 293 viruses (31 influenza A (H1N1)pdm09; 215 influenza A (H3N2); and 47 influenza B viruses) collected since October 1, 2016. The hemagglutinin (HA) gene segment of all influenza A (H1N1)pdm09 viruses analyzed belonged to genetic group 6B.1. Influenza A (H3N2) virus HA gene segments analyzed belonged to genetic groups 3C.2a or 3C.3a. Genetic group 3C.2a includes a newly emerging subgroup known as 3C.2a1. The HA of influenza B/Victoria-lineage viruses all belonged to genetic group V1A. The HA of all influenza B/Yamagata-lineage viruses analyzed belonged to genetic group Y3.
Eighty-nine influenza viruses (26 influenza A (H1N1)pdm09; 42 influenza A (H3N2); and 21 influenza B viruses) collected since October 1, 2016 have been antigenically characterized. All 26 (100%) influenza A (H1N1)pdm09 viruses were antigenically similar to A/California/7/2009, the reference virus representing the influenza A (H1N1) component of the 2016–17 Northern Hemisphere vaccine. Thirty-nine of 42 (92.9%) influenza A (H3N2) viruses were antigenically similar to the A/Hong Kong/4801/2014–like cell propagated reference viruses belonging to genetic group 3C.2a and representing the influenza A (H3N2) component of the 2016–17 Northern Hemisphere vaccine. Six of seven (85.7%) influenza B/Victoria-lineage viruses were antigenically similar to B/Brisbane/60/2008, the reference virus representing the influenza B component of the 2016–17 Northern Hemisphere trivalent and quadrivalent vaccines. All 14 (100%) influenza B/Yamagata-lineage viruses were antigenically similar to B/Phuket/3073/2013, the reference virus representing the influenza B component of the 2016–17 Northern Hemisphere quadrivalent vaccine.
Antiviral Resistance of Influenza Viruses
The WHO Collaborating Center for Surveillance, Epidemiology, and Control of Influenza at CDC tested 205 influenza virus specimens (35 influenza A (H1N1)pdm09, 123 influenza A (H3N2), and 47 influenza B viruses) collected since October 1, 2016, in the United States for resistance to the influenza neuraminidase inhibitor antiviral medications oseltamivir, zanamivir, and peramivir, drugs currently approved for use against seasonal influenza. All 205 influenza viruses tested were found to be sensitive to all three antiviral medications. An additional 31 influenza A (H3N2) viruses were tested for resistance to oseltamivir and zanamivir, and they were found to be sensitive to both antiviral medications.
Outpatient Illness Surveillance
During October 2–December 17, 2016, the weekly percentage of outpatient visits for influenza-like illness (ILI)†† reported by approximately 2,000 U.S. Outpatient ILI Surveillance Network (ILINet) providers in 50 states, New York City, Chicago, the U.S. Virgin Islands, Puerto Rico, and the District of Columbia, ranged from 1.2% to 2.3.%. The week ending December 17 was the first week of the 2016–17 season during which the percentage of outpatient visits for ILI was above the national baseline§§ (weekly percentage of visits for ILI was 2.3%, national baseline is 2.2%) (Figure 3). During the 1997–98 through 2015–16 influenza seasons, excluding the 2009 pandemic, the peak weekly percentages of outpatient visits for ILI ranged from 2.4% to 7.7%. For the week ending December 17, on a regional level, the percentage of outpatient visits for ILI ranged from 1.1% to 3.5%. Five regions (regions 2, 4, 8, 9, and 10) reported a proportion of outpatient visits for ILI at or above their region-specific baseline levels. Data collected from ILINet also are used to produce a measure of ILI activity¶¶ by jurisdiction. For the week ending December 17, Oklahoma and Puerto Rico experienced high ILI activity; New York City and two states (Arizona and Georgia) experienced moderate ILI activity; 10 states (Alabama, Colorado, Hawaii, Louisiana, Mississippi, Nevada, New Jersey, North Carolina, South Carolina, and Virginia) experienced low ILI activity. The remaining 37 states experienced minimal ILI activity, and the District of Columbia had insufficient data to calculate an ILI activity level.
Geographic Spread of Influenza Activity
Influenza activity levels reported by state and territorial epidemiologists indicate the geographic spread of influenza viruses. For the week ending December 17 (week 50), Puerto Rico reported widespread activity.*** Guam, the U.S. Virgin Islands, and 13 states (Alabama, Alaska, Connecticut, Massachusetts, New Hampshire, New York, North Carolina, Oklahoma, Oregon, Pennsylvania, South Carolina, Virginia, and Washington) reported regional activity. The District of Columbia and 26 states (Arizona, Arkansas, Colorado, Delaware, Florida, Georgia, Hawaii, Idaho, Indiana, Kentucky, Louisiana, Maine, Maryland, Michigan, Minnesota, Mississippi, Missouri, Nebraska, Nevada, New Jersey, North Dakota, Ohio, Tennessee, Texas, Utah, and Wyoming) reported local activity, and 11 states (California, Illinois, Iowa, Kansas, Montana, New Mexico, Rhode Island, South Dakota, Vermont, West Virginia, and Wisconsin) reported sporadic activity.
Influenza-Associated Hospitalizations
CDC monitors hospitalizations associated with laboratory-confirmed influenza infection in adults and children through the Influenza Hospitalization Surveillance Network (FluSurv-NET),††† which covers approximately 27 million persons (9% of the U.S. population). During October 1–December 17, 2016, 676 laboratory-confirmed influenza-associated hospitalizations were reported, yielding an overall hospitalization rate of 2.4 per 100,000 population. Persons aged ≥65 years had the highest rate of laboratory-confirmed influenza-associated hospitalization and accounted for approximately 53.1% of reported influenza-associated hospitalizations.
Pneumonia and Influenza-Attributed Mortality
CDC tracks pneumonia and influenza (P&I)–attributed deaths through the National Center for Health Statistics (NCHS) Mortality Reporting System. The percentages of deaths attributed to P&I are released 2 weeks after the week of death to allow for collection of sufficient data to produce a stable P&I mortality percentage. Based on data from NCHS available December 23, 2016, 5.9% (1,763 of 29,760) of all U.S. deaths occurring during the week ending December 3, 2016 (week 48) were attributed to P&I. This percentage is below the epidemic threshold§§§ of 6.9% for week 48. Since October 2, the weekly percentage of deaths attributed to P&I has ranged from 5.4% to 5.9% and has not exceeded the epidemic threshold this season. P&I percentages for recent weeks might be artificially low because of a backlog of records requiring manual processing, and the percentage of deaths caused by P&I is higher among manually coded death certificates than among machine-coded death certificates. The percentages of death caused by P&I will likely increase as more data become available. During the previous five influenza seasons, the peak weekly percentage of deaths attributable to P&I ranged from 8.2% in the 2015–16 season to 11.1% in the 2012–13 season.
Influenza-Associated Pediatric Mortality
As of December 17, 2016 (week 50), no influenza-associated pediatric deaths occurring during the 2016–17 season were reported to CDC. During the previous three influenza seasons, the number of influenza-associated pediatric deaths ranged from 89 in the 2015–16 season to 148 in the 2014–15 season.
Discussion
Influenza activity in the United States was low in October 2016, and has been slowly increasing since November, 2016. Peak influenza activity in the United States most commonly occurs during December–March, but substantial influenza activity can occur as early as November, and activity can last until May. During the 2013–14 and 2014–15 influenza seasons, activity began relatively early and peaked in late December and early January; however, during the 2015–16 season, activity did not begin to increase until early January and peaked in mid-March. While it is not possible to predict when influenza activity will peak for the current season, influenza activity will likely increase in the coming weeks.
During October 2–December 17, 2016, influenza A (H3N2) viruses were identified more frequently in the United States than other influenza viruses, but influenza A (H1N1)pdm09 and influenza B viruses were also reported. Influenza A (H3N2) virus–predominant seasons are typically more severe overall than influenza A (H1N1)pdm09 virus–predominant seasons, and are especially severe among the elderly and the very young (1). The majority of the influenza viruses collected in the United States since October 1, 2016, were characterized antigenically or genetically as being similar to the reference viruses representing vaccine components recommended for the 2016–17 Northern Hemisphere influenza vaccines.
Annual influenza vaccination is the most effective method of preventing influenza and its complications. In the United States, during the 2010–11 through 2015–16 influenza seasons, influenza vaccination prevented an estimated 1.6 million to 6.7 million cases and 39,301–86,730 hospitalizations each season (2). Twice a year, WHO convenes a meeting to review available surveillance, laboratory, and clinical data and makes recommendations for the composition of influenza vaccines. These meetings take place in February and September for selection of vaccine strains for Northern Hemisphere and Southern Hemisphere influenza vaccines, respectively. In February 2016, WHO recommended that the 2016–17 trivalent influenza vaccines used in the Northern Hemisphere contain an A/California/7/2009 (H1N1)pdm09-like virus, an A/Hong Kong/4801/2014 (H3N2)-like virus, and a B/Brisbane/60/2008-like virus (B/Victoria lineage), and that quadrivalent vaccines contain the viruses recommended for the trivalent vaccines, as well as a B/Phuket/3073/2013-like virus (B/Yamagata lineage) (3). In September 2016, WHO recommended that the 2017 Southern Hemisphere influenza vaccine strains remain the same as the 2016–17 Northern Hemisphere influenza vaccine strains with the exception of the A (H1N1)pdm09-like virus. The A (H1N1)pdm09-like virus recommended for the 2017 Southern Hemisphere vaccine is an A/Michigan/45/2015 (H1N1)pdm09-like virus. This change represents the first update of the A(H1N1) vaccine strain since the 2009 pandemic. Although almost all recent A(H1N1)pdm09 viruses were antigenically indistinguishable from A/California/07/2009 using ferret antisera, some human postvaccination sera showed reduced titers against recently circulating A (H1N1)pdm09 viruses belonging to the 6B.1 and 6B.2 genetic groups (3,4).
As of early November, 2016, approximately 60% of the U.S. population had not been vaccinated against influenza for the 2016–17 season (5).Overall influenza vaccination coverage during the 2015–16 season was 45.6%. This represents a 1.5 percentage point decrease compared with the 2014–15 season, a decline driven by decreased vaccine uptake among persons aged 50–64 years and ≥65 years (6). Because the peak month for influenza activity typically ranges from December to March, and influenza activity for the current season is just beginning to increase, receiving influenza vaccine at this time still offers substantial public health benefits. Health care providers should recommend influenza vaccine now and throughout the influenza season to all unvaccinated persons aged ≥6 months who do not have contraindications. Children aged 6 months–8 years who have not previously received a total of ≥2 doses of any trivalent or quadrivalent influenza vaccine (doses do not have to be received in the same influenza season) before July 1, 2016, require 2 doses for the 2016–17 season. The interval between the 2 doses should be at least 4 weeks (7).
Although influenza vaccination is the best way to reduce the impact of influenza, antiviral medications continue to be an important adjunct to vaccination for reducing the health impact of influenza. Available effective antiviral medications include oseltamivir, zanamivir, and peramivir. All influenza viruses collected since October 1, and tested for antiviral resistance, were found to be susceptible to these antiviral medications. Treatment as soon as possible with influenza antivirals is recommended for patients with confirmed or suspected influenza who have severe, complicated, or progressive illness; who require hospitalization; or who are at high risk for influenza complications.¶¶¶ Providers should not delay treatment while waiting for test results and should not rely on insensitive assays such as rapid antigen-detection influenza diagnostic tests to determine treatment (8).
Influenza surveillance reports for the United States are posted online weekly (https://www.cdc.gov/flu/weekly). Additional information regarding influenza viruses, influenza surveillance, influenza vaccine, influenza antiviral medications, and novel influenza A infections in humans is online (https://www.cdc.gov/flu).
Acknowledgments
State, county, city, and territorial health departments and public health laboratories; U.S. World Health Organization collaborating laboratories; National Respiratory and Enteric Virus Surveillance System laboratories; U.S. Outpatient Influenza-Like Illness Surveillance Network sites; FluSurv-NET; National Center for Health Statistics, CDC; World Health Organization, FluNet; Angie Foust, Elisabeth Blanchard, Priya Budhathoki, Thomas Rowe, Lizheng Guo, Ewelina Lyszkowicz, Shoshona Le, Malania Wilson, Juliana DaSilva, Alma Trujillo, Michael Hillman, Thomas Stark, Samuel Shepard, Sujatha Seenu, Ha Nguyen, Vasiliy Mishin, Margaret Okomo-Adhiambo, Michelle Adamczyk, Juan De la Cruz, Influenza Division, National Center for Immunization and Respiratory Diseases, CDC.
Corresponding author: Mei Shang, mshang@cdc.gov, 404-639-3747.
1Epidemic Intelligence Service, CDC; 2Influenza Division, National Center for Immunization and Respiratory Diseases, CDC.
* The CDC influenza surveillance system collects five categories of information from eight data sources: 1) viral surveillance (U.S. World Health Organization collaborating laboratories, the National Respiratory and Enteric Virus Surveillance System, and novel influenza A virus case reporting); 2) outpatient illness surveillance (U.S. Outpatient Influenza-Like Illness Surveillance Network); 3) mortality (the National Center for Health Statistics Mortality Surveillance System and influenza-associated pediatric mortality reports); 4) hospitalizations (FluSurv-NET, which includes the Emerging Infections Program and surveillance in three additional states); and 5) summary of the geographic spread of influenza (state and territorial epidemiologist reports). https://www.cdc.gov/flu/weekly/fluactivitysurv.htm.
† Data as of December 23, 2016.
§ The 10 regions include the following jurisdictions: Region 1: Connecticut, Maine, Massachusetts, New Hampshire, Rhode Island, and Vermont; Region 2: New Jersey, New York, Puerto Rico, and the U.S. Virgin Islands; Region 3: Delaware, District of Columbia, Maryland, Pennsylvania, Virginia, and West Virginia; Region 4: Alabama, Florida, Georgia, Kentucky, Mississippi, North Carolina, South Carolina, and Tennessee; Region 5: Illinois, Indiana, Michigan, Minnesota, Ohio, and Wisconsin; Region 6: Arkansas, Louisiana, New Mexico, Oklahoma, and Texas; Region 7: Iowa, Kansas, Missouri, and Nebraska; Region 8: Colorado, Montana, North Dakota, South Dakota, Utah, and Wyoming; Region 9: Arizona, California, Hawaii, Nevada, American Samoa, Commonwealth of the Northern Mariana Islands, Federated States of Micronesia, Guam, Marshall Islands, and Republic of Palau; Region 10: Alaska, Idaho, Oregon, and Washington.
¶ Influenza viruses that circulate in swine are called swine influenza viruses when isolated from swine, but are called variant influenza viruses when isolated from humans. Seasonal influenza viruses that circulate worldwide in the human population have important antigenic and genetic differences from influenza viruses circulating in swine.
** A virus is considered “reference virus-like” if its hemagglutination inhibition (HI) or neutralization focus reduction (FRA) titer is within fourfold of the homologous HI/FRA titer of the reference strain. A virus is considered as low to the reference virus if there is an eightfold or greater reduction in the HI or FRA titer when compared with the homologous HI or FRA titer of the reference strain.
†† Defined as a fever (temperature ≥100°F [≥37.8°C]), oral or equivalent, and cough and/or sore throat, without a known cause other than influenza.
§§ The national and regional baselines are the mean percentage of visits for influenza-like illness (ILI) during noninfluenza weeks for the previous three seasons plus two standard deviations. Noninfluenza weeks are defined as periods of ≥2 consecutive weeks in which each week accounted for <2% of the season’s total number of specimens that tested positive for influenza. National and regional percentages of patient visits for ILI are weighted on the basis of state population. Use of the national baseline for regional data is not appropriate.
¶¶ Activity levels are based on the percentage of outpatient visits in a jurisdiction attributed to ILI and are compared with the average percentage of ILI visits that occur during weeks with little or no influenza virus circulation. Activity levels range from minimal, corresponding to ILI activity from outpatient clinics at or below the average, to high, corresponding to ILI activity from outpatient clinics much higher than the average. Because the clinical definition of ILI is nonspecific, not all ILI is caused by influenza; however, when combined with laboratory data, the information on ILI activity provides a clearer picture of influenza activity in the United States.
*** Levels of activity are 1) no activity; 2) sporadic: isolated laboratory-confirmed influenza cases or a laboratory-confirmed outbreak in one institution, with no increase in activity; 3) local: increased ILI, or two or more institutional outbreaks (ILI or laboratory-confirmed influenza) in one region of the state, with recent laboratory evidence of influenza in that region; virus activity no greater than sporadic in other regions; 4) regional: increased ILI activity or institutional outbreaks (ILI or laboratory-confirmed influenza) in two or more outbreaks, but less than half of the regions in the state with recent laboratory evidence of influenza in those regions; and 5) widespread: increased ILI activity or institutional outbreaks (ILI or laboratory-confirmed influenza) in at least half the regions in the state, with recent laboratory evidence of influenza in the state.
††† FluSurv-NET conducts population-based surveillance for laboratory-confirmed, influenza-associated hospitalizations in children and adolescents aged <18 years (since the 2003–04 influenza season) and adults aged ≥18 years (since the 2005–06 influenza season). The FluSurv-NET covers approximately 70 counties in the 10 Emerging Infections Program states (California, Colorado, Connecticut, Georgia, Maryland, Minnesota, New Mexico, New York, Oregon, and Tennessee) and additional Influenza Hospitalization Surveillance Project (IHSP) states. IHSP began during the 2009–10 season to enhance surveillance during the 2009 H1N1 pandemic. IHSP sites included Iowa, Idaho, Michigan, Oklahoma, and South Dakota during the 2009–10 season; Idaho, Michigan, Ohio, Oklahoma, Rhode Island, and Utah during the 2010–11 season; Michigan, Ohio, Rhode Island, and Utah during the 2011–12 season; Iowa, Michigan, Ohio, Rhode Island, and Utah during the 2012–13 season; and Michigan, Ohio, and Utah during the 2013–14, 2014–15, 2015–16, and 2016–17 seasons. Cumulative unadjusted incidence rates are calculated using CDC’s National Center for Health Statistics population estimates for the counties included in the surveillance catchment area. Laboratory confirmation is dependent on clinician-ordered influenza testing, and testing for influenza often is underutilized because of the poor reliability of rapid test results and greater reliance on clinical diagnosis for influenza. Therefore, cases identified as part of influenza hospitalization surveillance likely are an underestimation of the actual number of persons hospitalized with influenza.
§§§ The seasonal baseline proportion of pneumonia and influenza (P&I) deaths is projected using a robust regression procedure, in which a periodic regression model is applied to the observed percentage of deaths from P&I that were reported by the National Center for Health Statistics Mortality Surveillance System during the preceding 5 years. The epidemic threshold is set at 1.645 standard deviations above the seasonal baseline.
¶¶¶ Persons at higher risk include 1) children aged <2 years; 2) adults aged ≥65 years; 3) persons with chronic pulmonary conditions (including asthma), cardiovascular disease (except hypertension alone), renal, hepatic, hematologic (including sickle cell) disease, metabolic disorders (including diabetes mellitus), or neurologic and neurodevelopmental conditions (including disorders of the brain, spinal cord, peripheral nerves, and muscles, such as cerebral palsy, epilepsy [seizure disorders], stroke, intellectual disability [mental retardation], moderate to severe developmental delay, muscular dystrophy, or spinal cord injury); 4) persons with immunosuppression, including that caused by medications or by human immunodeficiency virus infection; 5) women who are pregnant or postpartum (within 2 weeks after delivery); 6) persons aged ≤18 years who are receiving long-term aspirin therapy; 7) American Indians/Alaska Natives; 8) persons with extreme obesity (i.e., body mass index ≥40); and 9) residents of nursing homes and other chronic care facilities.
References
- Davlin SL, Blanton L, Kniss K, et al. Influenza activity—United States, 2015–16 season and composition of the 2016–17 influenza vaccine. MMWR Morb Mortal Wkly Rep 2016;65:567–75. CrossRefexternal icon PubMedexternal icon
- CDC. Influenza (flu): estimated influenza illnesses, medical visits, hospitalizations, and deaths averted by vaccination in the United States. Atlanta, GA: US Department of Health and Human Services, CDC; 2016. https://www.cdc.gov/flu/about/disease/2015-16.htm
- World Health Organization. Recommended composition of influenza virus vaccines for use in the 2016–2017 northern hemisphere influenza season. Geneva, Switzerland: World Health Organization; 2016. http://www.who.int/influenza/vaccines/virus/recommendations/201602_recommendation.pdf?ua=1pdf iconexternal icon
- World Health Organization. Recommended composition of influenza virus vaccines for use in the 2017 southern hemisphere influenza season. Geneva, Switzerland: World Health Organization; 2016. http://www.who.int/influenza/vaccines/virus/recommendations/201609_recommendation.pdf?ua=1pdf iconexternal icon
- CDC. National early-season flu vaccination coverage, United States, November 2016. Atlanta, GA: US Department of Health and Human Services, CDC; 2016. https://www.cdc.gov/flu/fluvaxview/nifs-estimates-nov2016.htm
- CDC. Flu vaccination coverage, United States, 2015–16 influenza season. Atlanta, GA: US Department of Health and Human Services, CDC; 2016. https://www.cdc.gov/flu/fluvaxview/coverage-1516estimates.htm
- Grohskopf LA, Sokolow LZ, Broder KR, et al. Prevention and control of seasonal influenza with vaccines. MMWR Recomm Rep 2016;65(No. RR-5). CrossRefexternal icon
- Fiore AE, Fry A, Shay D, Gubareva L, Bresee JS, Uyeki TM. Antiviral agents for the treatment and chemoprophylaxis of influenza—recommendations of the Advisory Committee on Immunization Practices (ACIP). MMWR Recomm Rep 2011;60(No. RR-1). PubMedexternal icon
 FIGURE 1. Number* and percentage of respiratory specimens testing positive for influenza reported by clinical laboratories, by influenza virus type and surveillance week — United States, October 2–December 17, 2016†
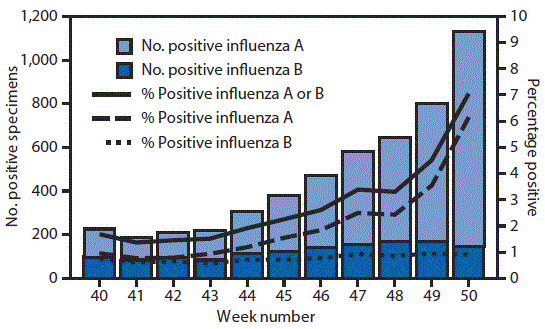
* N = 5,157.
† As of December 23, 2016.
FIGURE 2. Number* of respiratory specimens testing positive for influenza reported by public health laboratories, by influenza virus type, subtype/lineage, and surveillance week — United States, October 2–December 17, 2016†
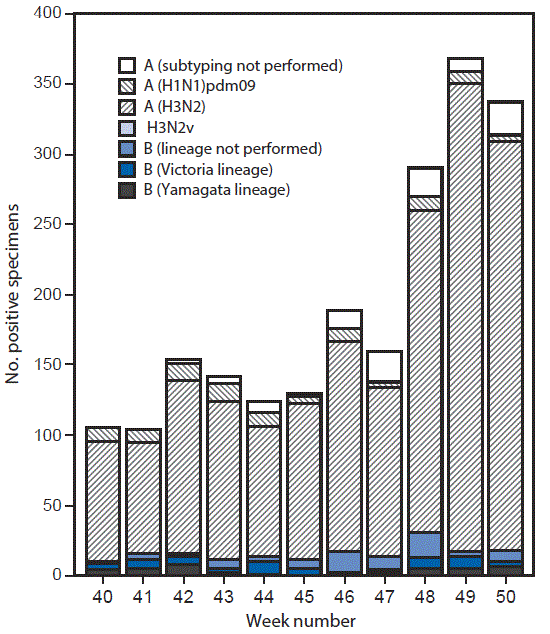
* N = 2,103.
† As of December 23, 2016.
FIGURE 3. Percentage of visits for influenza-like illness (ILI)* reported to the CDC, by surveillance week — Outpatient Influenza-Like Illness Surveillance Network, United States, 2016–17 influenza season and selected previous influenza seasons
* Defined as fever (temperature ≥100°F [≥37.8°C]), oral or equivalent, and cough and/or sore throat, without a known cause other than influenza.
Suggested citation for this article: Shang M, Blanton L, Kniss K, et al. Update: Influenza Activity — United States, October 2–December 17, 2016. MMWR Morb Mortal Wkly Rep 2016;65:1439–1444. DOI: http://dx.doi.org/10.15585/mmwr.mm655051a5external icon.
MMWR and Morbidity and Mortality Weekly Report are service marks of the U.S. Department of Health and Human Services.
Use of trade names and commercial sources is for identification only and does not imply endorsement by the U.S. Department of
Health and Human Services.
References to non-CDC sites on the Internet are
provided as a service to MMWR readers and do not constitute or imply
endorsement of these organizations or their programs by CDC or the U.S.
Department of Health and Human Services. CDC is not responsible for the content
of pages found at these sites. URL addresses listed in MMWR were current as of
the date of publication.
All HTML versions of MMWR articles are generated from final proofs through an automated process. This conversion might result in character translation or format errors in the HTML version. Users are referred to the electronic PDF version (https://www.cdc.gov/mmwr) and/or the original MMWR paper copy for printable versions of official text, figures, and tables.
Questions or messages regarding errors in formatting should be addressed to mmwrq@cdc.gov.