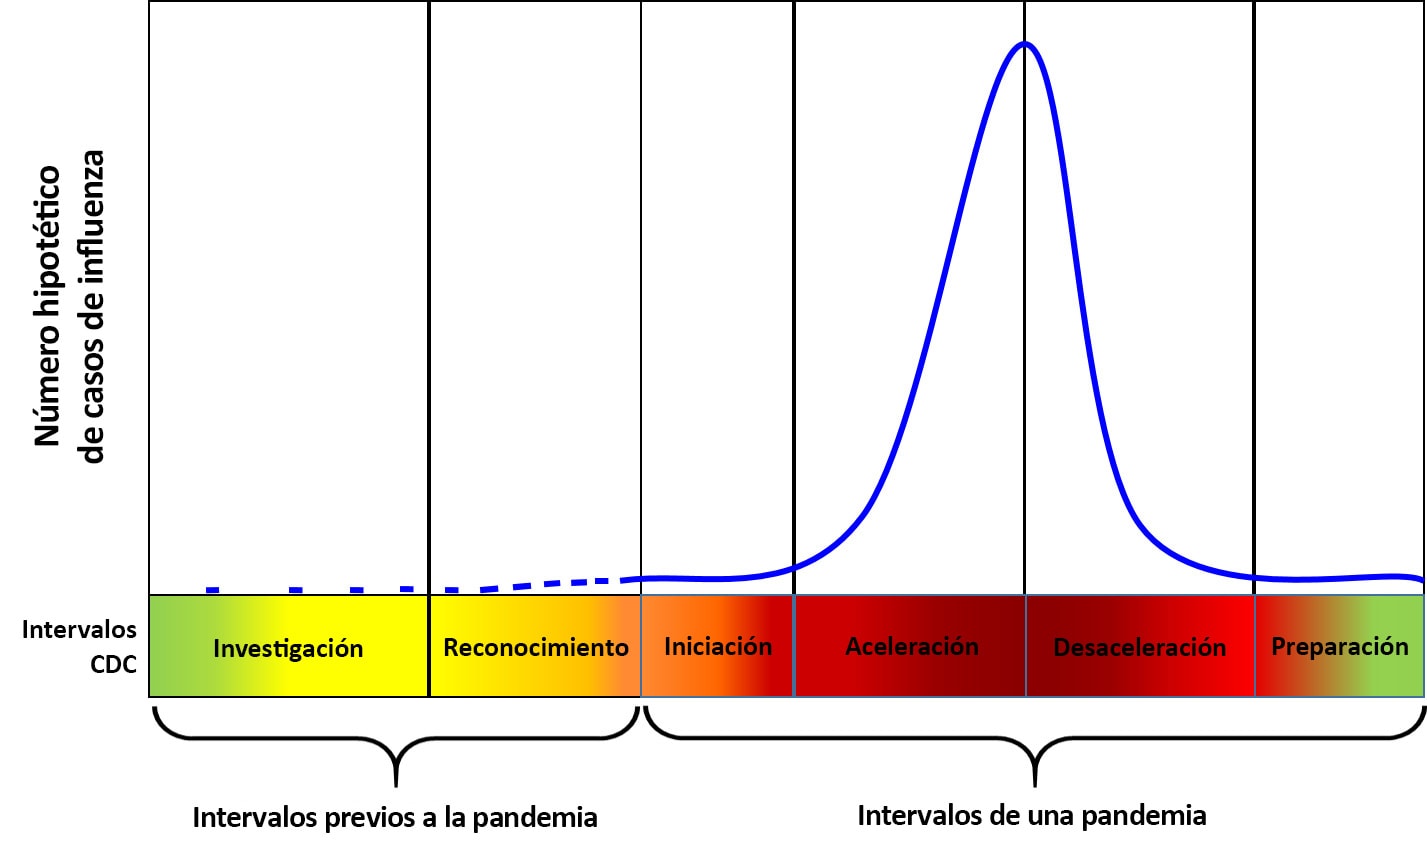
Preparedness and response framework for novel influenza A virus pandemics: CDC intervals 508
Back to: Pandemic Intervals Framework (PIF)

This figure shows a distribution curve of the hypothetical number of pandemic influenza cases across the six CDC intervals to the preparedness and response framework for novel influenza A virus pandemics. From left to right, the first two pre-pandemic intervals include “investigation” and “recognition.” During “investigation” and “recognition” intervals, the curve is flat, showing zero or low numbers of hypothetical pandemic influenza cases. Following the “recognition” interval are the four pandemic intervals – “initiation,” “acceleration,” “deceleration” and “preparation.” Within the pandemic intervals, the hypothetical number of influenza cases are normally distributed, where the greatest number of cases are located between the “acceleration” and “deceleration” intervals. From “initiation” to “acceleration,” the distribution curve of the hypothetical number of influenza cases greatly increases, showing the greatest number of hypothetical influenza cases at the end of the “acceleration” interval. From “deceleration” and ending with “preparation,” the hypothetical number of influenza cases greatly decreases, bringing the number of hypothetical influenza cases close to zero.