Pregnant Women and Flu Shots, Internet Panel Survey, United States, November 2012
Influenza (the flu) can cause a woman to become very sick if she is pregnant (1).
- The best way pregnant women can protect themselves from the flu is to get a flu shot (1).
Infants younger than 6 months old are also at high risk of severe illness from the flu, but they are too young to be vaccinated themselves (3).
- Infants whose mothers get the flu shot while pregnant have a lower risk of influenza illness and influenza-related hospitalizations during the first 6 months of life (4–5).
The national Healthy People 2020 target for flu vaccination among pregnant women is 80% (6). By season, coverage has varied:
- Before the 2009 season, flu vaccination levels among pregnant women were below 30% (7, 8).
- In the 2009-10 flu season, seasonal flu vaccination increased to 32%-47% (9, 10).
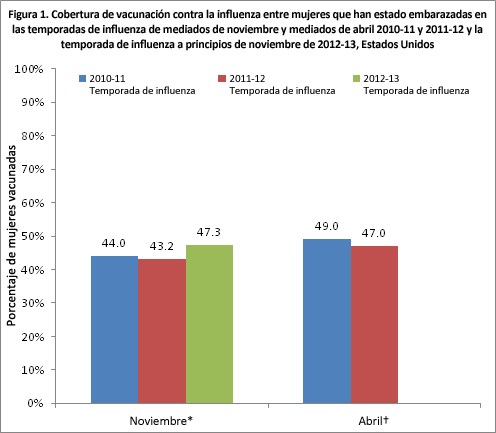
- In the 2010-11 flu season, flu vaccination was 38%-49% (8, 11).
- In the 2011-12 flu season, 47% were vaccinated (12).
CDC analyzed data from an internet panel survey conducted November 1-9, 2012 of women who were pregnant any time since July 2012 to provide a timely estimate of vaccination coverage among pregnant women. The results of this survey provide information for use by vaccination campaigns during National Influenza Vaccination Week (December 2-8, 2012). This report provides early-flu season (early November) estimates of vaccine uptake by pregnant women so far this year. Final 2012-13 flu season coverage estimates for pregnant women will become available after the end of the season.
Key Findings
- By early season (early November 2012) 2012-13, flu vaccination coverage among pregnant women was 47.3%, similar to vaccination coverage by early season 2011-12 (43.0%).
- In the previous two seasons, vaccination coverage increased by 5-17 percentage points from early to end of the flu season (11, 12).
- If a similar proportion is vaccinated before the end of the flu season, overall coverage will still remain substantially below the Healthy People 2020 flu vaccination target of 80% for pregnant women (6).
- In the previous two seasons, vaccination coverage increased by 5-17 percentage points from early to end of the flu season (11, 12).
- Women receiving a doctor’s or other medical professional’s recommendation and offer had a
- 1.6 times higher chance to be vaccinated (73.5%) than women receiving only a recommendation but no offer (45.1%) and
- 4.8 times higher chance to be vaccinated than women not receiving a recommendation or offer (15.4%).
- Most women (97.7%) reported visiting a doctor or other medical professional at least once since July 1, 2012; among these women, 46.1% reported receiving an offer for influenza vaccination from the provider, 18.6% received only a recommendation, and 35.2% received neither an offer nor a recommendation for flu vaccination.
- Conclusion/recommendation:
- Health care providers for pregnant women, especially obstetricians and midwives, are encouraged to continue to recommend and offer flu shots to pregnant women throughout the influenza season to prevent the flu.
Sample Demographics
- A total of 2,072 women pregnant anytime between July 1-November 9, 2012 were included in the survey.
- By age, 700 (34.7%) were 18 to 24 years, 1,372 (65.3%) were 25 to 49 years.
- By race/ethnicity, 248 (22.9%) were Hispanics, 1,307 (50.0%) were non-Hispanic whites, 313 (19.0%) were non-Hispanic blacks, and 204 (8.1%) were non-Hispanic others.
- By education, 1,153 (56.4%) were women with less than a college degree, 696 (32.6%) were women with a college degree, and 223 (11.0%) were women with greater than a college degree.
- By type of medical insurance, 1,127 (53.3%) were women with private or military insurance, 880 (44.0%) were women with any public insurance, and 186 (9.2%) were women with no insurance at all.
- By high-risk conditions‡, 944 (48.0%) were women with high-risk conditions and 1,128 (52.0%) were women without high-risk conditions.
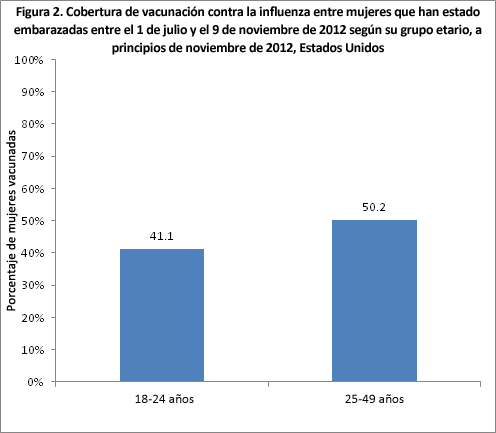
Coverage by Age Group
- Younger pregnant women (18-24 years) were less likely to be vaccinated (41.1%) than pregnant women 25-49 years (50.2%).
- Younger pregnant women had similar coverage (41.1%) compared to the prior early season (39.9%).
- The estimate for pregnant women 25-49 years (50.2%) was higher compared to the prior season (45.0%).
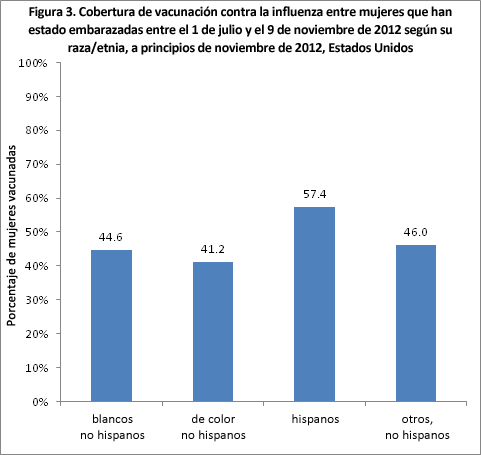
Coverage by Race/Ethnicity
- Flu vaccination coverage was 57.4% among Hispanic women, higher than coverage for non-Hispanic other women (46.0%), non-Hispanic white women (44.6%), and non-Hispanic black women (41.2%).
- There were no differences in coverage estimates across the four racial/ethnic groups in November 2011.
- Coverage among Hispanics increased from 48.6% in November 2011 to 57.4% in November 2012. Coverage among all other racial/ethnic groups was similar between the two surveys.
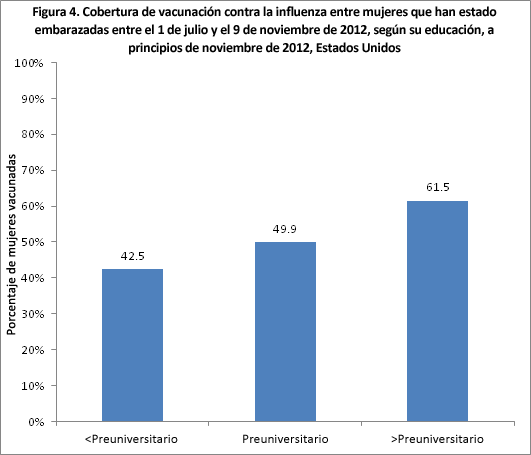
Coverage by Education
- Vaccination coverage among pregnant women with less than a college degree (42.5%) was lowest, followed by pregnant women with a college degree (49.9%), and women with more than a college degree (61.5%).
- Coverage this season so far was higher than November 2011 results for women with less than a college degree (36.2%) and women with more than a college degree (53.9%).
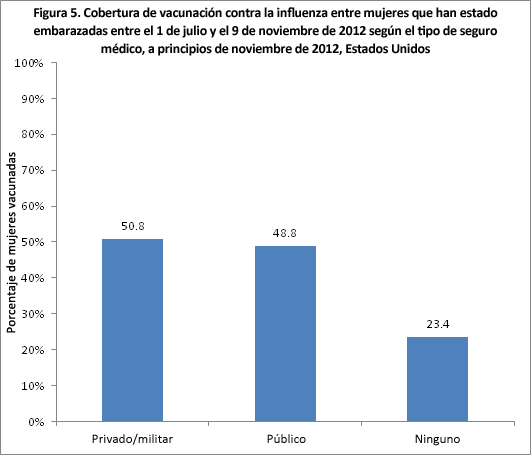
Coverage by Type of Medical Insurance
- Pregnant women who reported having private/military or public medical insurance at the time of the survey had higher vaccination coverage (50.8% and 48.8%, respectively) than pregnant women who reported not having insurance (23.4%).
- Only 9.0% of pregnant women reported not having medical insurance.
- Among pregnant women who reported having medical insurance, those with private/military insurance (50.8%) had similar vaccination coverage than those with public insurance (48.8%).
- In November 2011, women with private/military insurance had higher coverage (52.0 %) than women with any public insurance (41.4%).
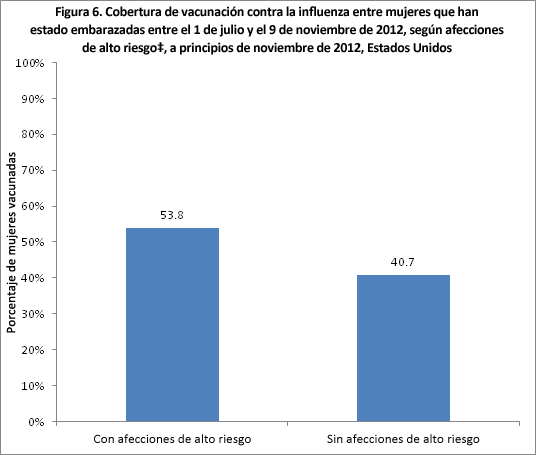
Coverage by Other High-Risk Conditions
- Women with an additional high-risk condition besides pregnancy that increases the risk of severe influenza had higher vaccination coverage (53.8%) than women with no other high-risk conditions (40.7%).
- These estimates were similar to the results from the November 2011 survey (52.9% and 40.0%, respectively).
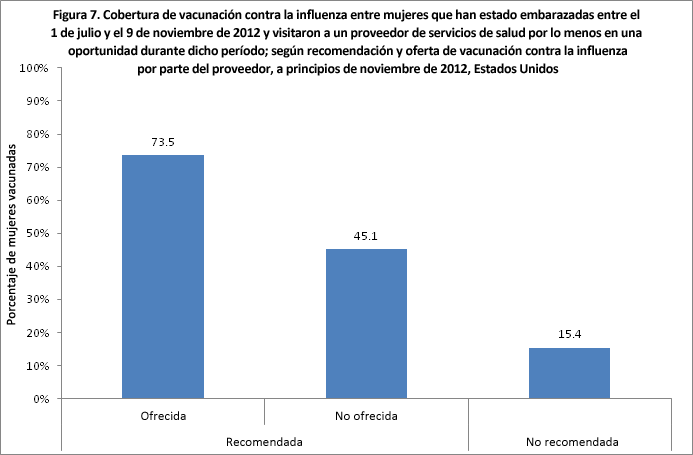
Coverage by Doctor or Other Medical Professional Recommendation and Offer
- Most women (97.7%) reported visiting a doctor or other medical professional at least once since July 1, 2012; among these women, 46.1% reported receiving an offer for influenza vaccination from the provider, 18.6% received only a recommendation, and 35.2% received neither an offer nor a recommendation for flu vaccination.
- Flu vaccination coverage among pregnant women was highest (73.5%) when they received both a recommendation and an offer for vaccination from their doctor or other medical professional.
- 45.1% of pregnant women were vaccinated when they received only a recommendation and not offer of vaccination from their doctor or other medical professional.
- 15.4% of pregnant women were vaccinated when they did not receive a recommendation for vaccination from their doctor or other medical professional.
- Similar relationships of vaccination coverage with provider recommendations and offering of flu vaccination were reported from the November 2011 survey.
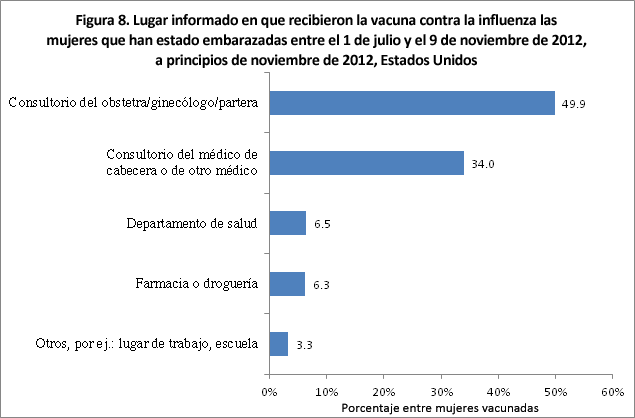
Place of Vaccination
- The most common place reported for receiving their flu vaccination was in the offices of an obstetrician/gynecologist or midwife during pregnancy (49.9%).
- These estimates were similar to the results from the November 2011 survey.
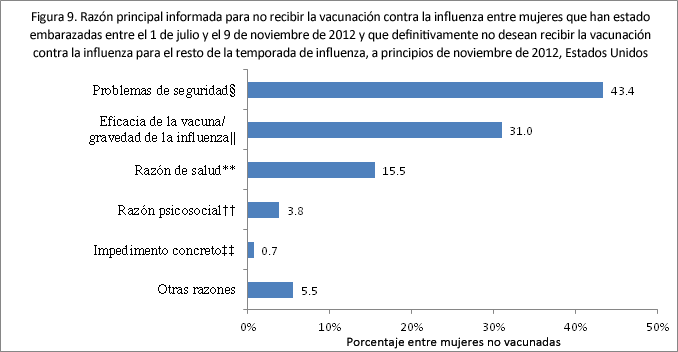
Main Reason for Not Receiving Vaccination
- Respondents were asked to report their main reason for not receiving and not intending to receive a flu shot.
- Responses were categorized as follows: safety concern (concern for safety for developing baby [among those currently pregnant], concern about safety risk to self, don’t trust the vaccine, concern about side effects of vaccine, and concern the vaccination would give me the flu); efficacy of vaccine/severity of the flu (don’t think the vaccine is effective, I do not need the vaccination, I don’t get very sick or can treat it); health reason (allergic, I get sick when I get the vaccine); psychosocial reason (afraid of needles, against religion); tangible barrier (insurance/cost; don’t have time/know where to go/who to call; vaccine not available); and other reason.
- The most common main reason reported for not receiving a flu shot and definitely not intending to receive a flu shot was safety concern by 43.4% of unvaccinated pregnant women.
- The second most common main reason was concern about the efficacy of the flu vaccine/severity of the flu (31.0%).
- Health reasons, psychosocial reasons, and other reasons were less frequently reported (15.5%, 3.8%, and 5.5%, respectively).
- Only 0.7% of women reported a tangible barrier of lack of medical insurance or cost, lack of time, unavailability of the vaccine, and lack of knowledge of where to get the vaccine or who to contact as a main reason for not receiving a flu shot.
What Can Be Done? (Recommendations)
Overall early season estimates of flu vaccination coverage among pregnant women were similar in 2012-13 (47.3%) compared to the prior season (43.2%). Flu vaccination coverage among women who reported their doctor or other medical professional both recommended and offered the flu vaccine was 73.5%, approaching the Healthy People 2020 target of 80% (6). Yet the coverage estimates among women who reported receiving only a recommendation or not receiving a recommendation were much lower. Among women who were pregnant at the time of the survey, a safety concern was the most common reason for not receiving a flu vaccination among women who were pregnant at the time of the survey (43.4%). Continued efforts are needed to improve flu vaccination coverage among pregnant women, including:
- Doctor or other medical professional recommendation:
- Doctor or other medical professional recommendation is a strong predictor of vaccination during pregnancy.
- If more pregnant women receive both a recommendation and offer of flu vaccination from their doctor or other medical professional, vaccination coverage should increase.
- Continue to vaccinate:
- Continue to offer flu vaccine to pregnant women throughout the flu season.
- Safety and efficacy:
- Health care providers and immunization programs should provide pregnant women with accurate information on:
- the risk of the flu to pregnant women and their baby; and
- the benefits and safety of influenza vaccination for the mother and the baby.
- Information is available at:
- Health care providers and immunization programs should provide pregnant women with accurate information on:
The November internet panel survey of pregnant women is designed to provide timely estimates of national flu vaccination coverage and to assess the effectiveness of current vaccination efforts. The follow-up survey in April 2013 will provide end of season flu vaccination coverage estimates.
Data Source and Methods
CDC conducted an internet panel survey during November 1-9, 2012, to provide early season estimates of flu vaccination coverage and information on knowledge, attitudes, and behaviors related to flu vaccination among pregnant women. Women 18–49 years who were pregnant at any time since July 1, 2012, were recruited from a SurveySpot, a general population Internet panel, the same recruitment mechanism that was used in the November 2011 survey. Eligible respondents were either pregnant or recently pregnant at the time of the survey. Of all panel members, 2,194 who were eligible and started the survey, 2,073 (94.5%) completed the online survey. The sample was weighted to reflect the age group, racial/ethnic, and geographic distribution of the total U.S. population of pregnant women during 1995 – 2008 (13–14).
Survey respondents were asked if they had a flu vaccination since July 1, 2012, and if yes, in which month and whether it was before, during, or after pregnancy. Pregnancy status questions included whether respondents were currently pregnant or pregnant at any time since July 1, 2012, and if so, what were the actual months of pregnancy. Respondents were asked their beginning and end (or expected delivery) date of the pregnancy. All respondents were asked if their doctor or other medical professional had recommended flu vaccine, had offered them flu vaccination during an office visit, and their attitudes towards and beliefs about flu and flu vaccination.
Weighted analyses were conducted using SAS v9.2 survey procedure. Because the opt-in Internet panel sample is based on those who initially self-selected for participation in the panel rather than a random probability sample, statistical measures such as calculation of confidence intervals and tests of differences cannot be performed.
Limitations
These results are preliminary and should be interpreted with caution. The follow-up internet panel survey in April 2013 will allow for assessment of flu vaccination coverage at the end of the flu season. State-specific estimates of flu vaccination coverage for the 2012-13 season will be provided later from the Pregnancy Risk Assessment Monitoring System (PRAMS). National coverage estimates from the Behavioral Risk Factor Surveillance System (BRFSS) will be provided later for comparison to the internet panel survey estimates.
The findings in the report are subject to several limitations.
- The sample was not necessarily representative of all pregnant women in the United States, because the survey was conducted among a smaller group of volunteers who were already enrolled in SurveySpot rather than a randomly-selected sample.
- Some bias might remain after weighting adjustments, given the exclusion of women with no internet access and the self-selection processes for entry into the panel and participation in the survey. Estimates might be biased if the selection processes for entry into the Internet panel and a woman’s decision to participate in this particular survey were related to receipt of vaccination.
- All vaccination results are based on self-report and not validated by medical record review.
- This year we included women who were pregnant in July 2012, when a limited supply flu vaccine was available. Some women who delivered in July or August may have had a very limited opportunity to be vaccinated.
Despite these limitations, internet panel surveys are a useful surveillance tool for timely early season and postseason evaluation of flu vaccination coverage and knowledge, attitude, practice, and barrier data.
AUTHORS: Helen Ding, MD, MSPH, Gary L Euler, Dr.PH, Erin D. Kennedy, DVM, MPH, Stacie M, Greby, DVM, MPH; Immunization Services Division, NCIRD
Related Links
- Influenza vaccination coverage: FluVaxView
- 2011-12 end-of–season MMWR
- 2011-12 early season online report
- 2010-2011 end-of-season MMWR
- 2010-2011 early season online report
- Flu vaccination accepted by pregnant women not linked with miscarriage
- Pregnancy Risk Assessment Monitoring System website
- Prevention and Control of Influenza with Vaccines: Recommendations of the Advisory Committee on Immunization Practice (ACIP)-Unites State, 2012-12 influenza Season
- Text4Baby
- SSI
- SurveySpot
- Follow CDC Flu on Twitter: @CDCFlu
References/Resources
- CDC. Prevention and control of influenza with vaccines: recommendations of the Advisory Committee on Immunization Practices (ACIP), 2010. MMWR Recomm Rep 2010; 59 (RR-8):1-62.
- Influenza vaccination during pregnancy. Committee Opinion No. 468. American College of Obstetricians and Gynecologists. Obstet Gynecol 2010;116:1006–7.
- Poehling KA, Edwards KM, Weinberg GA, et al. The Underrecognized Burden of Influenza in Young Children. N Engl J Med 2006; 355:31-40.
- Zaman K, Roy E, Arifeen SE, et al. Effectiveness of maternal influenza immunization in mothers and infants. N Engl J Med 2006; 355:31-40.
- Poehling KA, Szilagyi PG, Staat MA, et al., Impact of maternal immunization on influenza hospitalizations in infants. Am J Obstet Gynecol 2011; 204(6 Suppl 1):S141–8.
- Healthy-People.gov. Immunization and Infectious Diseases. Available at http://www.healthypeople.gov/2020/topicsobjectives2020/objectiveslist.aspx?topicId=23. Accessed November 30, 2012.
- Lu P, Bridges CB, Euler GL, Singleton JA. Influenza vaccination of recommended adult populations, U.S., 1989–2005. Vaccine 2008; 26:1786–93.
- Kennedy ED, Ahluwalia IB, Ding H, Lu PJ, Singleton JA, Bridges CB. Monitoring seasonal influenza vaccination coverage among pregnant women in the United States. Am J Obstet Gynecol 2012; 207(3 Suppl):S9–16.
- Ding H, Santibanez TA, Jamieson DJ, et al. Influenza vaccination coverage among pregnant women—National 2009 H1N1 Flu Survey (NHFS). Am J Obstet Gynecol 2011; 204(6 Suppl 1):S96–106.
- CDC. Influenza Vaccination Coverage Among Pregnant Women — 29 States and New York City, 2009-10 season, MMWR 2012; 61(7):113-118.
- CDC. Influenza vaccination coverage among pregnant women—United States, 2010–11 influenza season. MMWR 2012; 60(32):1078-82.
- CDC. Influenza vaccination coverage among pregnant women— 2011–12 influenza season, United States. MMWR 2012; 61:758-63.
- Ventura SJ, Curtin SC, Abma JC, Henshaw SK. Estimated Pregnancy Rates and Rates of Pregnancy Outcomes for the United States, 1990–2008. 2012. National Vital Statistics Reports, Volume 60, Number 7. Hyattsville, MD: National Center for Health Statistics.
- Guttmacher Institute. (2012). Total number of pregnancies among women aged 15-44, 2008. Available at http://www.guttmacher.org/datacenter/. Accessed November 30, 2012.
Footnotes
* Vaccinated as of early-November based on women that provided a response to vaccination status questions and were pregnant anytime during August-November for the 2010-11 (n=1486) and 2011-12 (n=2,047) influenza seasons and July- November for the 2012-13 influenza season (n=2072).
† Vaccinated as of mid-April based on women that provided a response to vaccination status questions and were pregnant anytime during October 2010-January 2011 for the 2010-11 influenza season (n=1,457) and women that were pregnant anytime during October 2011-January 2012 for the 2011-12 influenza season (n=1,660).
‡ Currently have conditions associated with increased risk for serious medical complications from influenza, including chronic asthma, a lung condition other than asthma, a heart condition, diabetes, a kidney condition, a liver condition, or a weakened immune system caused by a chronic illness or by medicines taken for a chronic illness and obesity.
§ Safety concern is defined as the following responses: “Concern about safety risk to the unborn baby”, “Concern vaccination would give me the flu”, “Concern about safety risk to myself”, “I don’t trust the vaccine because it is too new and not enough research has been done”, and “Concern about side effects of the vaccination”.
|| Efficacy of vaccine/severity of the flu is defined as the following responses: “Don’t think the vaccine is effective in preventing flu”, “I do not need the vaccination”, and “I don’t get very sick or can treat it”.
** Health reason is defined as the following responses: “I get sick when I get the vaccination” and “I am allergic, on medication or the vaccination is not recommended to me”.
†† Psychosocial reason is defined as the following responses: “Against religious/spiritual belief” and “I am afraid of needles/shots”.
‡‡ Tangible barrier is defined as the following responses: “Not covered by insurance/don’t have insurance”, “The flu vaccine costs too much”, “Copay cost too much”, “ Don’t have time/don’t know where to go/who to call”, and “The vaccination was not available”.