National Early Season Flu Vaccination Coverage, United States, November 2014
Influenza (flu) is a serious disease that can lead to hospitalization and sometimes even death.
- Anyone can get sick from the flu.
Flu vaccination is the best way to prevent people from getting the flu and potentially serious flu-related complications (1,2). CDC recommends that everyone 6 months and older get a flu vaccination each flu season (3).
CDC collected survey data with the National Immunization Survey-Flu (NIS-Flu) for children 6 months through 17 years and the National Internet Flu Survey (NIFS) for adults 18 years and older for this report. NIS-Flu data were collected by telephone surveys of parents conducted during October 1–November 15, 2014, while the NIFS data were collected through an Internet survey conducted during October 29–November 12, 2014. The results of these surveys provide information for use by vaccination campaigns during National Influenza Vaccination Week (NIVW), held December 7–13, 2014. This report provides early flu season estimates of how many people in the United States had received a flu vaccination. Final 2014–15 flu season vaccination coverage estimates will be available after the end of the season.
Key Findings
- Fewer than half of children and adults were vaccinated by early flu season (early November 2014):
- 40.8% of people 6 months and older
- 42.0% of children 6 months through 17 years
- 40.4% of adults 18 years and older
- Among all persons ≥ 6 months, children, and adults, early 2014–15 flu season vaccination coverage was similar to coverage at the same time last flu season.
- Among both adults and children, early season flu vaccination coverage showed no racial/ethnic differences.
- Among both adults and children, the most common places reported for receiving flu vaccination were medical locations. Retail settings and workplaces were other important venues for adults.
Conclusions/Recommendations:
- As of early November, more than half of Americans had not yet received a flu vaccination and lacked the protection it offers from flu and its complications.
- Individuals should get flu vaccinations as soon as possible.
- A provider recommendation to get a flu vaccination is an important factor in a patient’s decision to get vaccinated. As early as possible in the season all providers should assess the flu vaccination status of their patients, strongly recommend flu vaccination, and provide flu vaccination or refer the patient for flu vaccination (4).
- Vaccination providers and immunization programs should work to increase community demand for vaccination and expand access to vaccination services.
- Worksites can collaborate with vaccination providers and immunization programs to promote flu vaccination and even offer vaccination at work.
- Vaccination providers should ensure systems are in place to ensure patients receive a strong recommendation for vaccination.
Who Was Vaccinated?
Flu Vaccination Coverage by Age Group
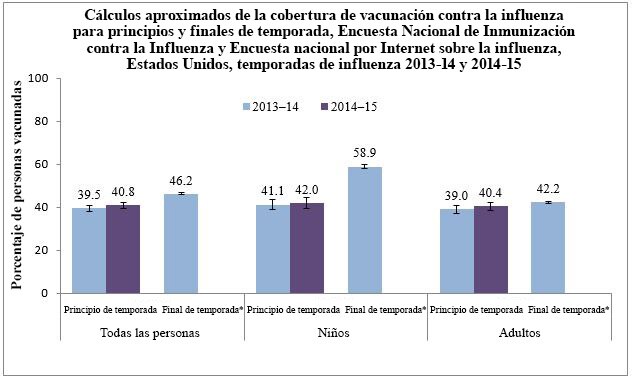
- Flu vaccination coverage early in the 2014–15 season was 40.8%, similar to coverage estimates for the same time last flu season (39.5%) (Table 1).
Table 1.
|
November 2013 |
November 2014 |
|
|---|---|---|
| Overall (≥ 6 months) |
39.5 ± 1.5 |
40.8 ± 1.5 |
| Children (6 months-17 years) |
41.1 ± 2.3 |
42.0 ± 2.5 |
| Adults (≥ 18 years) |
39.0 ± 1.8 |
40.4 ± 1.8 |
- Among children 6 months through 17 years, early season flu vaccination coverage with one or more doses was 42.0% as of early November, similar to coverage estimates from the same time last flu season (Table 2).
- All child age groups had similar coverage compared to the same time last season.
- Flu vaccination coverage among children decreased as age increased.
- Flu vaccination coverage was highest among children 6 months – 4 years (49.7%) and lowest among children 13–17 years (31.8%).
Table 2.
|
November 2013 |
November 2014 |
|
|---|---|---|
| All children (6 months-17 years) |
41.1 ± 2.3 |
42.0 ± 2.5 |
| 6 months-4 years |
50.6 ± 4.7 |
49.7 ± 5.2 |
| 5-12 years |
43.0 ± 3.1 |
44.6 ± 3.8 |
| 13-17 years |
30.2 ± 4.4 |
31.8 ± 3.9 |
- Among adults ≥ 18 years, early season flu vaccination coverage as of early November was 40.4%, similar to the same time last flu season (Table 3).
- Flu vaccination coverage among adults increased compared to the same time last season in only the following group:
- Adults 50–64 years by 4.8 percentage points
- Flu vaccination coverage among adults increased as age increased.
- Vaccination coverage among adults was highest among adults ≥ 65 years (61.7%) and lowest among adults 18–49 years (31.4%).
- Adults 18–64 years with high-risk conditions had higher coverage (43.2%) than adults 18–64 years without high-risk conditions (32.6%).
Table 3.
|
November 2013 |
November 2014 |
|
|---|---|---|
| All adults (≥ 18 years) |
39.0 ± 1.8 |
40.4 ± 1.8 |
| 18-49 years |
31.4 ± 2.5 |
31.4 ± 2.7 |
| 50-64 years |
39.1 ± 3.1 |
43.9 ± 3.2§ |
| 18-64 years |
33.9 ± 2.0 |
35.5 ± 2.1 |
| 18-64 years, HR|| |
44.2 ± 3.7 |
43.2 ± 4.1 |
| 18-64 years, non-HR|| |
30.0 ± 2.3 |
32.6 ± 2.4 |
| 65+ years |
61.8 ± 3.9 |
61.7 ± 3.7 |
Flu Vaccination Coverage by Race/Ethnicity
- For all racial/ethnic groups, coverage among children was similar compared to coverage at the same time last season (Table 4).
- There were no racial/ethnic group differences in flu vaccination coverage among children based on these early season estimates.
Table 4.
|
November 2013 |
November 2014 |
|
|---|---|---|
| Children (6 months-17 years) |
41.1 ± 2.3 |
42.0 ± 2.5 |
| Hispanic |
41.2 ± 5.2 |
42.9 ± 6.1 |
| Non-Hispanic, white only |
41.1 ± 3.0 |
40.2 ± 2.7 |
| Non-Hispanic, black only |
37.6 ± 5.5 |
46.3 ± 8.8 |
| Non-Hispanic, other or multiple race |
46.1 ± 7.0 |
42.6 ± 7.1 |
- For all racial/ethnic groups, coverage among adults was similar compared to the same time last season.
- Among adults, there were no early season differences among the racial/ethnic groups.
Table 5.
|
November 2013 |
November 2014 |
|
|---|---|---|
| Adults (≥ 18 years) |
39.0 ± 1.8 |
40.4 ± 1.8 |
| Hispanic |
37.3 ± 5.2 |
36.5 ± 5.2 |
| Non-Hispanic, white only |
39.8 ± 2.2 |
41.3 ± 2.3 |
| Non-Hispanic, black only |
34.6 ± 4.4 |
39.2 ± 4.6 |
| Non-Hispanic, other or multiple race |
40.7 ± 5.5 |
42.7 ± 6.2 |
Place of Vaccination
- The most common place of vaccination among both adults and children early in the 2014–15 season was a doctor’s office (children: 63.3%; adults: 33.2%). Other medical places included hospital or emergency department (children: 5.2%; adults 5.9%) or clinic, health center, or other medical place (children: 17.3%; adults: 10.1%) (Figure 2).
- Among children, the most common non-medical places of flu vaccination were school (4.8%) and pharmacy (4.7%).
- Other common places of flu vaccination reported by adults included pharmacy (25.5%) and workplace (18.8%).
- These results are similar to estimates from the early 2013–14 season; early in that season 64.6% of children and 31.8% of adults were vaccinated in a doctor’s office.
Figure 2.

What Can Be Done? (Recommendations)
Although many children (42.0%) and adults (40.4%) were vaccinated early in the 2014–15 flu season, more than half of the United States population ≥ 6 months had not received a flu vaccination by the end of the survey period. Continued efforts are needed to expand vaccination coverage during the next few months of this season to increase the number of people protected against the flu and to reduce the risk of flu, including:
Racial and ethnic disparities among adults:
- Although no racial/ethnic differences in flu vaccination coverage were observed so far this season, other studies have found lower coverage among Hispanic and non-Hispanic black adults compared to non-Hispanic white adults. Therefore, continued efforts to increase vaccination coverage among adults in all racial and ethnic groups are necessary to eliminate racial/ethnic differences in flu vaccination coverage.
- Immunization programs should work with leaders in communities with low vaccination coverage to promote vaccination and ensure all members have access to flu vaccination.
- Immunization programs should also work with vaccination providers in these communities to encourage them to routinely offer flu vaccination to all of their patients.
Implement proven strategies to increase vaccination coverage:
- Increased effort is needed to implement strategies proven to increase flu vaccination coverage.
- Health care providers should strongly recommend flu vaccination. Patients are much more likely to get vaccinated when health care providers give a strong recommendation for vaccination.
- The National Vaccine Advisory Committee (NVAC) revised the Standards for Adult Immunization Practice in 2013. The Standards can be used by all providers to ensure patients are assessed for flu vaccination status at every visit, providers strongly recommend a flu vaccination if needed, a vaccination is provided or the patient is referred for vaccination, and the vaccination is documented.
- Health care providers can utilize Immunization Information Systems, provider assessment and feedback, provider reminders, and standing orders, as well as combinations of these interventions, which are evidence-based provider/system strategies to increase vaccination.
- Providers should refer to The Guide to Community Preventive Servicesexternal icon that provides guidance on effective interventions for increasing vaccinationexternal icon.
- Health care providers should strongly recommend flu vaccination. Patients are much more likely to get vaccinated when health care providers give a strong recommendation for vaccination.
Data Sources and Methods
The 2014–15 flu vaccination coverage estimates and findings reported here are early season estimates. These results will differ from final end-of-season coverage estimates expected in September 2015. End-of-season estimates in Figure 1 are from the NIS-Flu for children and the Behavioral Risk Factor Surveillance System (BRFSS) for adults (Flu Vaccination Coverage, United States, 2013-14 Influenza Season).
The 2014–15 season estimates in this report are based on two different data sources. Estimates for children are based on data from NIS-Flu, while estimates for adults are based on data from the NIFS. NIS-Flu data from October 1–November 15, 2014 are compared to NIS-Flu data from October 1–November 16, 2013. Adult NIFS data from October 29–November 12, 2014 were compared to NIFS data from November 1-14, 2013 (National Early Season Flu Vaccination Coverage, United States, November 2013).
National Immunization Survey-Flu (NIS-Flu)
The NIS-Flu is an ongoing, national list-assisted random-digit-dialed dual frame land line and cellular telephone survey of households with children. It includes three components: the NIS for children 19–35 months, the NIS-Teen for children 13–17 years and a short flu module for all other children 6–18 months and 3–12 years not eligible for the NIS and NIS-Teen identified during the household screening process. Respondents ≥18 years were asked if their child had received a flu vaccination since July 1, 2014 and, if so, in which month and year. The survey interviewers conduct the survey in both English and Spanish; interviews conducted in other languages used language line interpretation services.
Flu vaccination coverage estimates presented in this report are based on interviews conducted from October 1–November 15, 2014. A total of 26,882 NIS-Flu interviews were completed for children 6 months to 17 years. Of these, 14,282 were by landline telephone and 12,600 were by cellular telephone. For reporting place of vaccination, three weeks of NIS interviews (October 26–November 15, 2014) were combined; therefore, the place of vaccination estimates are based on 5,157 vaccinated children.
Flu vaccination coverage estimates represent approximately the cumulative proportion of persons vaccinated as of November 12, 2014. Coverage was calculated using an enhanced estimation strategy that resembles the Kaplan-Meier estimation procedure (5). The flu vaccination coverage estimates represent receipt of at least one dose of flu vaccine. Place of vaccination was estimated using simple weighted proportions. All estimates were weighted based on the probability of selection of the telephone number, including adjustments for non-response at the telephone number resolution and household screening stages, probability of selecting the child of interest within the household, and for person non-response. The data were also weighted using a ratio adjustment to population controls (age, sex, race/ethnicity, and geographic area). All NIS-Flu estimates reported here were calculated by NORC at the University of Chicago, utilizing weights they developed.
National Internet Flu Survey (NIFS)
The adult estimates are based on data from the 2014 NIFS, which was conducted by RTI International and GfK Custom Research, LLC and sponsored by CDC, to rapidly collect flu vaccination-related data early during the 2014–15 flu season. The survey was conducted using a probability-based panel designed to be representative of the U.S. population. The internet panel survey was conducted in English only.
The sample was stratified by age group and by race/ethnicity. For this ongoing panel, participants are initially chosen by a random selection of telephone numbers and residential addresses. Persons in selected households are then invited by telephone or mail to participate in the web-enabled KnowledgePanel®. For those who agree to participate but do not already have Internet access, GfK provides both a laptop and Internet access at no cost. People who already have computers and Internet service participate using their own equipment. Panelists receive unique login information for accessing surveys online, and are sent e-mails throughout each month inviting them to participate in surveys. The field period of data collection for the NIFS was October 29–November 12, 2014. A survey invitation was sent to a sample consisting of 6,771 panel members. A total of 3,325 completed the NIFS. All NIFS estimates reported here were calculated by RTI, utilizing analysis weights developed by GfK. Survey responses “don’t know” and “refused” were excluded from the analyses.
Additional Methods
Differences between groups and between 2013-14 and 2014-15 seasons were determined using t-tests with significance at p<0.05 and assuming large degrees of freedom (thus using the value of 1.96 for the critical value). Any differences noted as increases or decreases were statistically significant differences; when it is stated that estimates were similar or there was no difference this indicates that any differences were not statistically significant.
To produce a national estimate of flu vaccination coverage for all persons ≥6 months, the estimates from the NIS-Flu for children and from the NIFS for adults were combined by weighting them by population size (based on census population counts).
Limitations
- The findings reported here are early season estimates and final end-of-season coverage estimates will likely increase.
- Children 6 months–8 years may require two doses of flu vaccine to optimize immunity (3); estimates in this report reflect parental report of at least one dose, and not whether those children requiring two doses were fully immunized.
- NIS-Flu is a telephone survey that excludes households with no telephone service. Non-coverage and non-response bias may remain after weighting adjustments.
- The adult estimates in this report are based upon NIFS, an Internet panel survey. Although the Internet panel was probability-based, the estimates may not represent all adults in the United States, and bias may remain after the weighting adjustments.
- All data rely upon self-report and are not validated with medical records; validity studies have shown that parental report (for children) and self-report (for adults) may overestimate flu vaccination coverage.
Authors:
Anup Srivastav1, Tammy A. Santibanez2, Katherine E. Kahn1, Yusheng Zhai1, Stacie M. Greby2, Carolyn Bridges2, Peng-Jun Lu2, Walter W. Williams2, James A. Singleton2, M. Christopher Stinger3, Jill A. Dever3, Michael S.S. Lawrence4, Mansour Fahimi4, Nicholas Davis5
1 Leidos Inc.
2 Immunization Services Division, National Center for Immunization and Respiratory Diseases, Centers for Disease Control and Prevention
3 RTI International
4 GfK Customs Research
5 NORC at University of Chicago
Related Links
- FluVaxView – Influenza Vaccination Coverage
- Prevention and Control of Seasonal Influenza with Vaccines: Recommendations of the Advisory Committee on Immunization Practices (ACIP) – United States, 2014–15 Influenza Season pdf icon[905 KB, 40 pages]
- Standards for Adult Immunization Practice
- Flu Vaccination Coverage, United States, 2013–14 Influenza Season pdf icon[600 KB, 18 pages]
- National Early Season Flu Vaccination Coverage, United States, November 2013 pdf icon[374 KB, 14 pages]
- Flu Vaccination Coverage, United States, 2012–13 Influenza Season pdf icon[415 KB, 16 pages]
- National Early Season Flu Vaccination Coverage, United States, 2012–13 Flu Season pdf icon[561 KB, 14 pages]
- Estimated Influenza Illnesses and Hospitalizations Averted by Influenza Vaccination – United States, 2012–13 Influenza Season
- Flu Vaccination Coverage, United States, 2011–12 Influenza Season pdf icon[726 KB, 11 pages]
- March Flu Vaccination Coverage, National Immunization Survey and National Flu Survey, March 2012
- Results from the November 2011 National Flu Survey – United States, 2011–12 Influenza Season
- National Immunization Survey
- CDC Influenza awareness campaign media relations toolkit, 2013 pdf icon[489 KB, 23 pages]
- Follow CDC Flu on Twitter: @CDCFlu
References
- CDC. Estimates of deaths associated with seasonal influenza–United States, 1976-2007. MMWR 2010;59:1057-1062.
- CDC. Estimated influenza illnesses and hospitalizations averted by influenza vaccination – United States, 2012–13 influenza season. MMWR 2013;62:997-1000.
- CDC. Prevention and control of seasonal influenza with vaccines: recommendations of the Advisory Committee on Immunization Practices (ACIP) – United States, 2013–2014. MMWR 2013;62(RR07):1-43.
- CDC. Standards for adult Immunization Practice. Available at: /vaccines/hcp/adults/for-practice/standards/index.html
- Ganesh N, Copeland KR, Davis ND, Singleton JA, Santibanez TA. Modeling H1N1 vaccination rates. Proc JSM Section on Survey Research Methods 2010;5263-5277.
Footnotes
* End-of-season estimates are from the National Immunization Survey-Flu for children and the Behavioral Risk Factor Surveillance System for adults (Flu Vaccination Coverage, United States, 2013-14 Influenza Season). The 2014-15 end-of-season estimates will not be available until September 2015.
† All percentages in the table are weighted to the U.S. population.
‡ CI=Confidence interval half-width.
§ Statistically significant difference between the 2014-15 season and the 2013-14 season by t-test (P<0.05).
|| Adults were considered at high risk (HR) if they had ever been told by a doctor or other health professional that they had asthma, diabetes, heart disease, other than high blood pressure, heart murmur, or mitral valve prolapse, a lung condition other than asthma, a kidney condition, obesity, sickle cell anemia or other anemia, a neurologic or neuromuscular condition that makes it difficult to cough, a liver condition or a weakened immune system caused by chronic illness or by medicines taken for chronic illness such as cancer, chemotherapy, HIV/AIDS, steroids, and transplant medicines.
¶ Race-ethnicity is either self-reported (NIFS) or reported by parent/guardian (NIS-Flu). Persons of Hispanic ethnicity may be of any race. Non-Hispanic, other or multiple race includes Asian, American Indian/Alaska Native, Native Hawaiian or other Pacific Islander, multiracial, and other races.
** Pharmacy/Store includes pharmacy or drugstore and local supermarket or grocery store.
†† Other place includes military-related place, other school such as trade school, home, and other unspecified non-medical place.