Flu Vaccination Coverage, United States, 2012-13 Influenza Season
Data sources: National Immunization Survey (NIS) and Behavioral Risk Factor Surveillance System (BRFSS)
Influenza or “flu” vaccination is the most effective strategy to prevent people from getting the flu and potentially serious flu-related complications (1). For this reason, the Advisory Committee on Immunization Practices (ACIP) recommends flu vaccination for everyone 6 months and older (2).
CDC analyzed the National Immunization Survey (NIS) data for children 6 months–17 years and the Behavioral Risk Factor Surveillance System (BRFSS) data for adults ≥18 years to estimate monthly cumulative national flu vaccination coverage from the 2012-13 influenza season. Coverage estimates are presented here by age group, race/ethnicity, and month of vaccination with additional information for adults with medical conditions (e.g., asthma, diabetes, or heart disease) that put them at higher risk for flu-related complications.
Additional estimates of flu vaccination coverage by age and racial/ethnic groups for the 2012-13 and earlier seasons for each state, each Health and Human Services region, and the United States are provided in FluVaxView as interactive maps, figures, and tables.
Key Findings
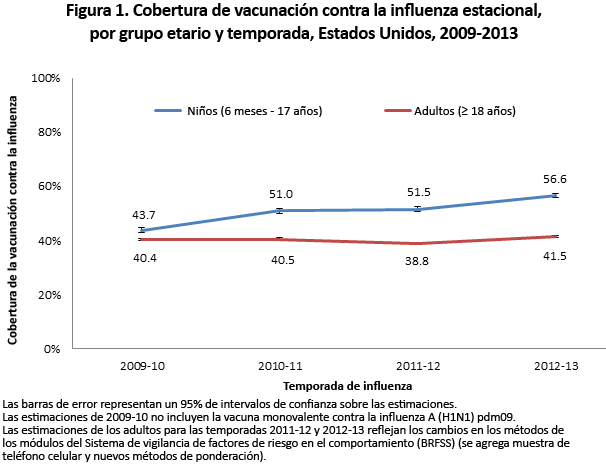
- Flu vaccination coverage among children increased by 5.1 percentage points for the 2012–13 season compared to the 2011–12 season and 12.9 percentage points from the 2009-10 season.
- Flu vaccination coverage among adults increased by 2.7 percentage points for the 2012-13 season compared to the 2011-12 season and 1.1 percentage points from the 2009-10 season.
- State variability in child and adult flu vaccination coverage continues to be large. (Interactive Report)
Who Was Vaccinated?
Coverage by Age Group
- Among all people ≥6 months, flu vaccination coverage during the 2012-13 flu season was 45.0%, 3.2 percentage points higher than coverage during the 2011–12 flu season.
- State-specific flu vaccination coverage among all people ≥6 months ranged from 34.1% (Florida) to 57.5% (Massachusetts). (Interactive Report)
| Age Group | Unweighted Sample Size | %§ ±95% CI¶ | Difference from the 2011-12 Season ±95% CI |
|---|---|---|---|
|
All People ≥6 months |
449,515 | 45.0 ± 0.4 | 3.2 ± 0.6|| |
|
Children (6 months−17 years) |
100,829 | 56.6 ± 0.9 | 5.1 ± 1.3|| |
|
Adults (≥18 years) |
348,686 | 41.5 ± 0.4 | 2.7 ± 0.6|| |
Children (6 months through 17 years)
- Flu vaccination coverage among children 6 months through 17 years decreased with increasing age:
- 6-23 months: 76.9%
- 2-4 years: 65.8%
- 5-12 years: 58.6%
- 13-17 years: 42.5%
- Among children 6 months–17 years, coverage with one or more doses of flu vaccine was 56.6%, an increase of 5.1 percentage points from the 2011–12 season.
- Among children 5-12 years, flu vaccination coverage was 4.4 percentage points higher for the 2012–13 season compared to the 2011–12 season.
- Among children 13-17 years, flu vaccination coverage was 8.8 percentage points higher for the 2012–13 season compared to the 2011–12 season.
- State-specific flu vaccination coverage for children 6 months through 17 years ranged from 44.0% (Idaho) to 81.6% (Rhode Island). (Interactive Report)
| Age Group | Unweighted Sample Size | %§ ±95% CI¶ | Difference from the 2011-12 Season ±95% CI |
|---|---|---|---|
|
6 months−17 years |
100,829 | 56.6 ± 0.9 | 5.1 ± 1.3|| |
|
6 months−4 years |
28,714 | 69.8 ± 1.6 | 2.2 ± 2.3 |
|
6−23 months |
10,632 | 76.9 ± 2.3 | 2.3 ± 3.4 |
|
2−4 years |
18,082 | 65.8 ± 2.0 | 2.5 ± 3.0 |
|
5−12 years |
47,526 | 58.6 ± 1.3 | 4.4 ± 1.9|| |
|
13−17 years |
24,589 | 42.5 ± 1.5 | 8.8 ± 2.2|| |
- Coverage among adults 18 years and older increased with increasing age:
- 18–49 years: 31.1%
- 50–64 years: 45.1%
- ≥65 years: 66.2%
- Among adults ≥18 years, coverage was 41.5%, 2.7 percentage points higher than 2011-12 coverage.
- Flu vaccination coverage was higher for the 2012-13 season compared to the 2011-12 season in each age group:
- 18–49 years: by 2.5 percentage points
- 50–64 years: by 2.4 percentage points
- ≥65 years: by 1.3 percentage points
- State-specific coverage for adults 18 years and older ranged from 30.8% (Florida) to 53.4% (South Dakota). (Interactive Report)
| Age Group | Unweighted Sample Size | %§ ±95% CI¶ | Difference from the 2011-12 Season ±95% CI |
|---|---|---|---|
|
≥18 years |
348,686 | 41.5± 0.4 | 2.7 ± 0.6|| |
|
18−64 years |
232,856 | 35.7± 0.6 | 2.6 ±0.8|| |
|
18−64 years at high risk** |
47,017 | 47.0± 1.4 | 1.8 ± 1.8 |
|
18−49 years |
120,286 | 31.1± 0.8 | 2.5 ± 1.0|| |
|
18−49 years at high risk |
17,296 | 39.8± 2.2 | 3.0 ±3.0|| |
|
50−64 years |
112,570 | 45.1± 0.8 | 2.4 ± 1.1|| |
|
≥65 years |
115,830 | 66.2± 0.8 | 1.3 ±1.1|| |
Coverage by Sex
Children (6 months through 17 years)
- There were no differences in flu vaccination coverage between male and female children.
- For adults, flu vaccination coverage was higher among females than males for every age group except adults ≥ 65 years.
| Male | Female | |||||
|---|---|---|---|---|---|---|
| Age Group | Unweighted Sample Size | %§ ±95% CI¶ | Unweighted Sample Size | %§ ±95% CI | ||
| All Ages | ||||||
|
≥6 months |
194,114 | 42.7 ±0.7†† | 255,401 | 47.2 ± 0.5†† | ||
| Children | ||||||
|
6 months−17 years |
52,244 | 56.4 ± 1.2 | 48,585 | 56.7 ± 1.2 | ||
|
6 months−4 years |
14,825 | 69.6 ± 2.2 | 13,889 | 70.1 ± 2.3 | ||
|
6−23 months |
5,471 | 76.2 ± 3.0 | 5,161 | 77.8 ± 3.5 | ||
|
2−4 years |
9,354 | 66.0 ± 2.8 | 8,728 | 65.6 ± 2.7 | ||
|
5−12 years |
24,510 | 58.7 ± 1.8 | 23,016 | 58.5 ± 1.8 | ||
|
13−17 years |
12,909 | 42.2 ± 2.0 | 11,680 | 42.8 ± 2.2 | ||
| Adults | ||||||
|
≥18 years |
141,870 | 38.3 ± 0.8†† | 206,816 | 44.5 ± 0.6†† | ||
|
18−64 years |
99,379 | 32.5 ± 0.8†† | 133,477 | 38.9 ± 0.8†† | ||
|
18−64 years at high risk** |
18,704 | 44.4 ± 2.0†† | 28,313 | 49.2 ± 1.8†† | ||
|
18−49 years |
52,717 | 28.0 ± 1.0†† | 67,569 | 34.4 ± 1.0†† | ||
|
18−49 years at high risk |
6,233 | 35.3 ± 3.5†† | 11,063 | 43.1 ± 2.5†† | ||
|
50−64 years |
46,662 | 42.3 ± 1.2†† | 65,908 | 47.5 ± 1.0†† | ||
|
≥65 years |
42,491 | 66.7 ± 1.2 | 73,339 | 65.9 ± 1.0 | ||
Coverage by Race/Ethnicity
- Among people ≥6 months, coverage for non-Hispanic whites (46.4%) was higher than that of non-Hispanic blacks (41.3%) and Hispanics (42.7%), and was similar to coverage among American Indians/Alaska Natives (AI/AN) (43.4%) and people of other or multiple races (44.4%).
- Additionally, coverage for Asians (49.9%) was higher than that of non-Hispanic whites, non-Hispanic blacks, Hispanics, AI/AN, and people of other or multiple races.
- Among all people ≥6 months, the only other difference between racial/ethnic groups was that coverage for non-Hispanic blacks was lower than that of people of other or multiple races; for all remaining racial/ethnic group comparisons coverage was similar.
- Among all people ≥6 months, coverage during the 2012-13 season increased by 3.3 percentage points for non-Hispanic whites, 2.3 for non-Hispanic blacks, 3.4 for Hispanics, 8.8 for Asians, and 6.9 for other or multiple race compared to the 2011-12 season; coverage did not change for AI/AN.
| Race/Ethnicity | Unweighted Sample Size | %§ ±95% CI¶ | Difference from the 2011-12 Season ±95% CI |
|---|---|---|---|
|
White only, non-Hispanic |
333,741 | 46.4 ± 0.4 | 3.3 ± 0.6|| |
|
Black only, non-Hispanic |
39,428 | 41.3 ± 1.4 | 2.3 ± 2.0|| |
|
Hispanic |
38,778 | 42.7 ± 1.4 | 3.4 ± 1.9|| |
|
Other, non-Hispanic (Total) |
32,070 | 46.7 ± 1.7 | 6.7 ± 2.4|| |
|
Asian |
10,463 | 49.9 ± 2.9 | 8.8 ± 4.2|| |
|
American Indian/Alaska Native |
6,638 | 43.4 ± 3.4 | -0.5 ± 5.6 |
|
Other or multiple race§§ |
14,969 | 44.4 ± 2.4 | 6.9 ± 3.3|| |
Children (6 months through 17 years)
- Non-Hispanic white children (53.8%) had lower flu vaccination coverage than non-Hispanic black children (56.7%), Hispanic children (60.9%), Asian children (65.8%) and children of other or multiple races (58.5%). White children had similar coverage to AI/AN children (52.5%).
- Additionally, non-Hispanic black children had lower flu vaccination coverage than Hispanic children and Asian children.
- Additionally, Hispanic children had higher coverage than AI/AN children, and Asian children had higher coverage than AI/AN children and children of other or multiple races; for all other racial/ethnic group comparisons, coverage was similar.
- Among children, coverage during the 2012-13 season increased by 6.2 percentage points for non-Hispanic whites, 7.6 for Asians, and 8.5 for other or multiple race compared to the 2011-12 season, while coverage for black, Hispanic, and AI/AN children did not change.
| Race/Ethnicity | Unweighted Sample Size | %§ ±95% CI¶ | Difference from the 2011-12 Season ±95% CI |
|---|---|---|---|
|
White only, non-Hispanic |
61,350 | 53.8 ± 1.0 | 6.2 ± 1.4|| |
|
Black only, non-Hispanic |
10,414 | 56.7 ± 2.7 | 3.0 ± 4.0 |
|
Hispanic |
17,661 | 60.9 ± 2.2 | 1.4 ± 3.3 |
|
Other, non-Hispanic (Total) |
11,404 | 60.8 ± 2.7 | 7.2 ± 3.9|| |
|
Asian |
4,128 | 65.8 ± 4.5 | 7.6 ± 6.5|| |
|
American Indian/Alaska Native |
1,586 | 52.5 ± 6.8 | 0.2 ± 9.9 |
|
Other or multiple race§§ |
5,690 | 58.5 ± 3.6 | 8.5 ± 5.4|| |
For additional race/ethnicity estimates by age group, please see attached tables 2012-13_coverage_supplemental-1 [XLSX-15K] Adults (18 years and older)
- Among adults, coverage for non-Hispanic whites (44.6%) was higher than coverage for non-Hispanic blacks (35.6%), Hispanics (33.8%), and adults of other or multiple races (38.0%); non-Hispanic whites had similar coverage to Asian (44.8%) and AI/AN (41.1%) adults.
- Additionally, non-Hispanic black adults had lower coverage than Asian adults and AI/AN adults, but had similar coverage to Hispanic adults, and adults of other or multiple race.
- Additionally, Hispanic adults had lower coverage than Asian adults, AI/AN adults, and adults of other or multiple races. Asian adults also had higher coverage than adults of other or multiple races. For all other racial/ethnic group comparisons, coverage was similar.
- Among adults, coverage during the 2012-13 season increased for all racial/ethnic groups compared to the 2011-12 season, except for AI/AN adults and adults of other or multiple races in which coverage did not change.
| Race/Ethnicity | Unweighted Sample Size | %§ ±95% CI¶ | Difference from the 2011-12 Season ±95% CI |
|---|---|---|---|
|
White only, non-Hispanic |
272,391 | 44.6 ± 0.4 | 2.7 ± 0.6|| |
|
Black only, non-Hispanic |
29,014 | 35.6 ± 1.6 | 2.9 ± 2.3|| |
|
Hispanic |
21,117 | 33.8 ± 1.8 | 4.4 ± 2.4|| |
|
Other, non-Hispanic (Total) |
20,666 | 41.6 ± 2.2 | 4.9 ± 3.0|| |
|
Asian |
6,335 | 44.8 ± 3.5 | 7.5 ± 4.9|| |
|
American Indian/Alaska Native |
5,052 | 41.1 ± 3.9 | -1.5 ± 6.3 |
|
Other or multiple race§§ |
9,279 | 38.0 ± 3.1 | 4.1 ± 4.1 |
For additional race/ethnicity estimates by age group, please see attached tables Race/ethnicity estimates by age group [XLSX-15K] Top of Page
Coverage by Month
Children (6 months through 17 years)
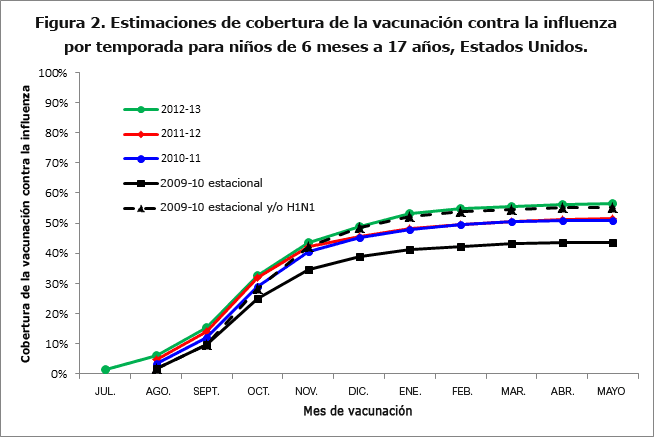
- Among children 6 months–17 years, coverage by the end of May was higher for the 2012–13 season compared to the 2011–12 season (Figure 2).
- Among children 6 months–17 years, cumulative monthly coverage for 2012-13 was similar to coverage in the 2011-12 season during the first few months of vaccination. In November the estimates began to diverge with coverage in 2012-13 being higher (Figure 2).
- Among children 6 months–17 years, seasonal flu vaccination coverage during the 2012-13 season exceeded coverage with the combined coverage of trivalent seasonal and/or 2009 influenza A (H1N1) pandemic monovalent vaccines during the 2009-10 season.
Estimated Numbers of Persons Vaccinated
The estimated number of persons with reported receipt of one or more seasonal flu vaccinations was 40.7 million (95% Confidence Interval [CI] 40.1 – 41.4 million) children (6 months-17 years) and 99.1 million (95% CI 98.2 – 100.1 million) adults (≥18 years), for an estimated 139.8 million (95% CI 138.3 – 141.5 million) people vaccinated against seasonal flu during July 2012 through May 2013 among the civilian, non-institutionalized U.S. population. These estimates do not include military or institutionalized persons who were vaccinated and do not count second doses given to children. The actual number of doses of flu vaccine distributed during the 2012-13 season was 134.9 million, indicating that the influenza vaccination coverage estimates reported in this article are too high. Flu vaccination status was based on self or parental report and not validated with medical records and, thus, is subject to respondent recall bias. A vaccination may have been reported when it was not received. Top of Page
What Can Be Done?
Overall, among persons 6 months and older, flu vaccination coverage was higher during the 2012-13 season (45.0%) compared to the 2011-12 season (41.8%). For all groups, flu vaccination coverage for the 2012-13 season remained well below the Healthy People 2020¶¶ targets of 70% for persons 6 months through 17 years and ≥18 years (3). There were some racial/ethnic differences in flu vaccination and also considerable variation in coverage by state. It is especially important that those at higher risk of flu complications (e.g., elderly, young children, pregnant women, and persons with chronic health conditions) are vaccinated each year.
The 2012-13 flu season is a reminder about the unpredictability and severity of flu. Flu activity began early in the United States and was high for 15 weeks. The season also was more severe than recent seasons. Hospitalization rates, especially in older adults, were the highest recorded since CDC began tracking that data, and deaths attributed to pneumonia and influenza (P & I) were the highest recorded in nearly a decade. The number of pediatric deaths (164) also was the highest since pediatric death surveillance began, with the exception of the 2009 H1N1 pandemic when there were 348 pediatric deaths.(4).
Since flu vaccination is the most effective strategy against the flu and serious flu-related complications, immunization programs are encouraged to use strategies known to increase coverage such as:
- Improve use of evidence-based practices at medical sites to increase access to vaccination services (e.g., reducing client costs, vaccination programs in schools and WIC settings, and home visits), increase community demand for vaccinations (e.g., client reminder/recall systems and school vaccination requirements), and ensure that all those who visit a provider during the flu season receive a vaccination recommendation and offer from their provider (e.g., standing orders and provider reminders)(5).
- Expand access through use of non-traditional settings for vaccination (e.g., pharmacy, workplace, and school venues) to reach individuals who may not visit a traditional physician’s office during the flu season.(6)
- Utilize immunization information systems, also known as registries, at the point of clinical care and at the population level to guide clinical and public health vaccination decisions.
These and other strategies are described in the Community Guide for Preventive Services (6). Top of Page
Data Sources and Methods
CDC analyzed NIS-Flu data collected October 2012 through June 2013 and BRFSS data collected September 2012 through June 2013 from all 50 states and the District of Columbia to estimate national and state level flu vaccination coverage from July 2012 through May 2013 for the 2012–13 flu season. These findings were compared to 2011-12 flu season estimates.
NIS-Flu is an ongoing, national dual landline cellular list-assisted random-digit-dialed telephone survey of households with children who are 19–35 months (NIS-Child) or 13–17 years (NIS-Teen) at the time of interview. For children 6–18 months and 3–12 years identified during screening households for NIS-Flu and NIS-Teen, a short flu vaccination module is conducted. Respondents ≥18 years were asked if their child had received a flu vaccination since July 1, 2012 and, if so, in which month and year. The Council of American Survey and Research Organizations (CASRO) response rate for the NIS-Flu across the three quarters of flu vaccination data collection was 56.2% for landline and 28.3% for cellular telephones.
BRFSS is an ongoing state-based monthly telephone survey which collects information on health conditions and risk behaviors from ~400,000 randomly selected persons ≥18 years among the non-institutionalized, U.S. civilian population. BRFSS respondents were asked if they had received a flu vaccine in the past 12 months, and if so, in which month and year. Race/ethnicity was missing for 1.6% of the adult sample. The median state BRFSS response rate was 47.0% for September-December 2012 and 45.6% for January-June 2013. Starting in 2011, BRFSS methods changed by adding persons in households with only cellular telephone service and improvements to weighting procedures (7); these changes were reflected in the 2011-12 and subsequent influenza vaccination coverage estimates.
Flu vaccination coverage estimates from both surveys were calculated using Kaplan-Meier survival analysis to determine the cumulative flu vaccination coverage (≥1 dose) during July 2012 through May 2013 using monthly interview data collected September 2012 (BRFSS) or October 2012 (NIS-Flu) through June 2013. For this analysis, vaccination status was defined differently from the analyses of the 2009-10, 2010-11, and 2011-12 flu seasons. Vaccination months changed to July through May from August through May, thus adding vaccinations given in July. NIS-Flu data were used to estimate coverage for children 6 months–17 years and BRFSS data were used to estimate coverage for adults ≥18 years. Coverage estimates for all persons ≥6 months were determined using combined state-level monthly estimates weighted by the age-specific populations of each state (8). For 12.5% of vaccinated NIS-Flu participants and 6.7% of vaccinated BRFSS participants, month of vaccination was not reported and was imputed from donor pools matched for week of interview, age group, state of residence, and race/ethnicity. Results from both surveys were weighted and analyzed with SAS and SUDAAN statistical software to account for the complex survey design. Differences between groups and between 2011-12 and 2012-13 seasons were determined using t-tests with significance at p<0.05. Differences mentioned in this report were statistically significant; not all statistically significant findings were mentioned. Top of Page
Limitations
The estimates in this report are subject to the following limitations. First, flu vaccination status was based on self or parental report and not validated with medical records and, thus, is subject to respondent recall bias. Second, response rates for both surveys were low and nonresponse bias may remain even after weighting adjustments. Third, combining NIS and BRFSS estimates allowed estimation of coverage for all persons ≥6 months; however, differences in survey methodology (e.g., different sampling frame, survey design, exact survey question wording, response rates and weighting) may result in different levels of bias that are averaged for this group. Fourth, the number of persons vaccinated was overestimated, evidenced by a higher number vaccinated than doses distributed as has occurred previously (9). Fifth, the 2012-13 flu season coverage estimates are not precisely comparable with estimates from the previous season due to the change made in 2012-13 to include July vaccinations; however the percentage of people aged ≥ 6 months with a vaccination in July 2012 was only 0.5%. Finally, some age-by-state-specific estimates in the accompanying interactive reports may be unreliable due to small sample size. Estimates flagged as potentially unreliable should be interpreted with caution.
Authors
Tammy A. Santibanez, PhD; Yusheng Zhai, MSPH; Alissa O’Halloran, MSPH; Katherine Kahn, MPH; Anup Srivastav, PhD, DVM; Peng-Jun Lu, MD, PhD; Erin D. Kennedy, DVM, MPH; Carolyn B. Bridges, MD; Walter W. Williams, MD, MPH; Stacie M. Greby, DVM, MPH; James A. Singleton, PhD Top of Page
Related Links
- National Immunization Survey (NIS):
- Behavioral Risk Factor Surveillance System (BRFSS):
- Flu vaccination coverage reports:
- Flu general information:
References
- CDC. Summary recommendations: Prevention and control of influenza vaccines; recommendations of the Advisory Committee on Immunization Practices-(ACIP)-United States, 2013-14. Available at: . Accessed August 20, 2013.
- CDC. Prevention and control of influenza with vaccines: recommendations of the Advisory Committee on Immunization Practices (ACIP), 2010. MMWR 2010;59 (No. RR-8). Available at: https://www.cdc.gov/mmwr/preview/mmwrhtml/rr5908a1.htm?s_cid=rr5908a1_w. Accessed September 23, 2013.
- US Department of Health and Human Services. Healthy People 2020: Immunization and Infectious Diseases. Available at: https://www.healthypeople.gov/2020/topics-objectives/topic/immunization-and-infectious-diseases/objectives. Accessed August 20, 2013.
- CDC. Influenza activity—United States, 2012-13 season and composition of the 2013-14 influenza vaccine. MMWR 2013; 62(23); 473-479. Available at: https://www.cdc.gov/mmwr/preview/mmwrhtml/mm6223a5.htm?s_cid=mm6223a5_w. Accessed September 23, 2013.
- Guide to Community Preventive Services. Available at: http://www.thecommunityguide.org/. Accessed August 12, 2013.
- Murphy PA, Frazee SG, Cantlin JP, Cohen E, Rosan JR, Harshburger DE. Pharmacy provision of influenza vaccinations in medically underserved communities. J Am Pharm Assoc 2012;52(1):67-70.
- CDC. Methodologic changes in the Behavioral Risk Factor Surveillance System in 2011 and potential effects on prevalence estimates. MMWR 2012;61(22):410-13. Available at: https://www.cdc.gov/mmwr/preview/mmwrhtml/mm6122a3.htm?s_cid=mm6122a3_w. Accessed September 23, 2013.
- Furlow-Parmley C, Singleton JA, Bardenheier B, Bryan L. Combining estimates from two surveys: an example from monitoring 2009 influenza A(H1N1) pandemic vaccination. Statist Med DOI: 10.1002/sim.5333.
- CDC. Interim results: state-specific seasonal influenza vaccination coverage―United States, August 2009–January 2010. MMWR 2010;59:477–84. Available at: https://www.cdc.gov/mmwr/preview/mmwrhtml/mm5916a1.htm. Accessed September 23, 2013.
Footnotes
* Estimates of the percentage of people vaccinated are based on interviews conducted beginning September (BRFSS) or October (NIS) 2012 through June 2013 and reported vaccinations from July 2012 through May 2013. † Excludes U.S.-affiliated areas. § Percentage Vaccinated. Percentages are weighted to the non-institutionalized U.S. civilian population. Month of vaccination was imputed for respondents with missing month of vaccination data. ¶ Confidence interval half-widths. || Statistically significant difference between the 2012-13 season and the 2011-12 season by t-test (P<0.05). ** Selected high-risk (HR) conditions; includes people with asthma, diabetes or heart disease. †† Statistically significant difference between male and female estimates by t-test (P<0.05). §§ Includes Native Hawaiian or other Pacific Islander, multiracial, and other races. ¶¶ See spreadsheet link at http://www.healthypeople.gov/2020/topicsobjectives2020/overview.aspx?topicId=23 (Tabs 12.11, 11.12, and 11.13). The National Health Interview Survey (NHIS) is the data source used to monitor the Healthy People objectives. Final NHIS estimates for the 2012-13 season will be available July 2014. Top of Page