Content on this page was developed during the 2009-2010 H1N1 pandemic and has not been updated.
- The H1N1 virus that caused that pandemic is now a regular human flu virus and continues to circulate seasonally worldwide.
- The English language content on this website is being archived for historic and reference purposes only.
- For current, updated information on seasonal flu, including information about H1N1, see the CDC Seasonal Flu website.
2009 H1N1-Related Deaths, Hospitalizations and Cases: Details of Extrapolations and Ranges: United States, Emerging Infections Program (EIP) Data
February 12, 2010 10:30 AM ET
In order to provide a fuller and more accurate picture of the burden of the 2009 H1N1 pandemic on the United States, CDC has developed a methodology to estimate ranges of 2009 H1N1 cases and related hospitalizations and deaths. This method uses raw data on 2009 H1N1 hospitalizations collected through CDC’s Emerging Infections Program (EIP), which conducts surveillance for laboratory-confirmed influenza-related hospitalizations in children and adults in 62 counties covering 13 metropolitan areas of 10 states. The estimated ranges generated by this methodology provide a sense of scale in terms of the burden of disease caused by 2009 H1N1. It may never be possible to validate the accuracy of these figures. The true number of cases, hospitalizations and deaths may lie within the ranges provided or it’s also possible that they may lie outside the ranges. This methodology is not predictive and cannot be used to forecast the number of cases, hospitalizations and deaths that will occur going forward over the course of the pandemic because they are based on actual surveillance data. More information about this methodology is contained in this document.
| EIP: Reports and extrapolations: Sept 01 to Jan. 16, 2010a |
|
| Reported | |
| Hospitalizations (lab confirmed) | 5,998 |
| Extrapolated to entire U.S. | |
| Hospitalizations | 87,529¶ (62,382 – 128,4907)§ |
| TOTALS: From April, 2009 through Jan. 16, 2010b | |
| Deaths‡‡# | |
| 0-17 yrs | 1,229
(876 – 1,805) |
| 18-64 yrs | 8,975 (6,396 – 13,175) |
| +65 yrs | 1,483 (1,057 – 2,177) |
| sub-totals | 11,687 (8,329 – 17,157) |
| Hospitalizations‡ | |
| 0-17 yrs | 81,988 (58,432 – 120,356) |
| 18-64 yrs | 150,386 (107,180 – 220,764) |
| +65 yrs | 24,958 (17,788 – 36,638) |
| sub-totals | 257,332 (183,400 – 377,758) |
| Cases‡‡‡# | |
| 0-17 yrs | 18,430,790 (13,135,604 – 27,056,007) |
| 18-64 yrs | 33,209,987 (23,668,722 – 48,751,553) |
| +65 yrs | 5,432,717 (3,871,891 – 7,975,112) |
| sub-totals | 57,073,493 (40,676,218 – 83,782,672) |
a. For EIP data covering period Weeks 35 (Aug 29 – Sept. 04) to Week 2 (week ending Jan 16, 2010). EIP data for that time period has been updated as of 2/11/2010
b. The totals presented here cover the entire period of the 2009 H1N1 influenza pandemic in the U.S., from April, 2009 up until January 16, 2010. For the period April through July 23, 2009, we used estimates of cases and hospitalizations as reported by Reed et al. (Emerg Infect Dis, Dec, 2009: available at: http://cdc.gov/eid/content/15/12/pdfs/09-1413.pdf). From August, 2009 onward we estimated cases, hospitalizations and deaths based on reports of laboratory-confirmed hospitalizations reported, extrapolating and correcting for under-reporting as described in the footnotes below.
¶ EIP extrapolation: Calculate rate per 100,000 per EIP site. To “balance” for different levels of influenza activity, each reporting week, we divide EIP sites, based on rates of hospitalization, into 3 equal groups – low, medium, high. We then take average rate of hospitalization of each of these 3 groups. We divide the 50 States, based on reported percent of visits that are for ILI, into 3 equal groups – low, medium, high. We then, using groupings of EIP sites by hospitalization rates and groupings of states by ILI activity, match EIP hospitalization rates to States (low-to-low, etc). We then extrapolate the EIP hospitalization rate from EIP group to the populations in those states similarly categorized. We repeat as needed to provide median, low and high estimates for each group. For example, median number of hospitalizations for a given week and state was calculated as follows: Median (point) estimate of number of hospitalizations in a state categorized as having “mid” level of influenza activity = (Median rate of hospitalization from EIP sites categorized as “mid” level of hospitalization rates.)* Population of the state categorized as having mid level of influenza activity/ 100,000. This calculation is repeated for each state, using the appropriate categorizations of “low,” “mid” and “high” categories of hospitalizations and levels of influenza activity. Finally, the estimates for each state are then added up to provide a total median (point) estimate for all 50 states for that week.
§ Ranges calculated using the same system as calculating the median (point) estimate, except instead of using the median rate of hospitalization we used either the low or high estimate of rates of hospitalization. For example, the low number of hospitalization for a given week and state was calculated as follows: Low estimate of number of hospitalizations in a state categorized as having “mid” level of influenza activity = (Low rate of hospitalization from EIP sites categorized as “mid” level of hospitalization rates.)* Population of the state categorized as having mid level of influenza activity/ 100,000. This calculation is repeated for each state, using the appropriate categorizations of “low,” “mid,” and “high” categories of hospitalizations and levels of influenza activity. Finally, the estimates for each state are then added up to provide a total low estimate for all 50 states for that week.
‡Corrected for under-reporting: Extrapolations of EIP hospitalizations to entire U.S. are corrected for under-reporting. Corrected by multiplying the extrapolated EIP hospitalizations by a factor of 2.7 (Reed et al., Emerg Infect Dis, Dec, 2009: available at: http://cdc.gov/eid/content/15/12/pdfs/09-1413.pdf).
‡‡Deaths are calculated as a percentage of hospitalizations using data from the Aggregate Hospitalization and Death Reporting Activity (AHDRA) surveillance system. This system has up to 35 states reporting. Using data of hospitalizations and deaths from AHDRA, by age group as reported through week 2, deaths as a percentage of hospitalizations were: 0-18 years of age – 1.46%; 19-64 years of age – 6.66%; 65+ years of age – 7.06%. We used, to simplify the process, the following percentages in our calculations: 0-18 years of age – 1.5%; adults (all ages) – 6.0%. We applied these percentages to all hospitalizations for all time periods covered in this Table.
‡‡‡Corrected for under-reporting: Cases: Case estimates calculated as 221.79 of hospitalizations. This factor was calculated using the median estimates of cases (3.052 million) and hospitalizations (13,764) from Reed et al.
# The range for deaths and cases were calculated using the same percentages as from the hospitalizations (see other notes for explanation of how hospitalization ranges were calculated). Upper limits are calculated as 1.47 of the point estimate for hospitalizations; the lower limit is calculated as .71 of point estimate for hospitalizations.
# The range for deaths and cases were calculated using the same percentages as from the hospitalizations (see other notes for explanation of how hospitalization ranges were calculated). Upper limits are calculated as 1.47 of the point estimate for hospitalizations; the lower limit is calculated as .71 of point estimate for hospitalizations.
An illustration of this methodology is below.
EIP: Steps
1. Reported
2. Extrapolation to
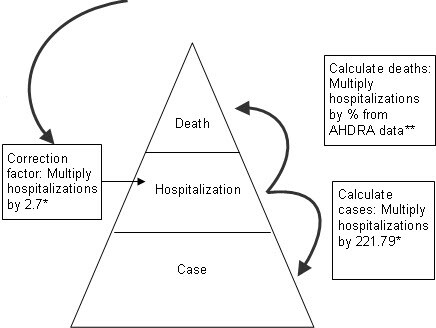
*Data for multiplication factors and % of cases that result in hospitalization from Reed et al, EID, 2009
** Deaths are calculated as a percentage of hospitalizations using data from the Aggregate Hospitalization and Death Reporting Activity (AHDRA) surveillance system
Get email updates
To receive weekly email updates about this site, enter your email address:
Contact Us:
- Centers for Disease Control and Prevention
1600 Clifton Rd
Atlanta, GA 30333 - 800-CDC-INFO
(800-232-4636)
TTY: (888) 232-6348 - Contact CDC-INFO
